The past session for the markets stayed quite trending, as the headline index continued with its upward move. While extending its gains, the Nifty 50 Index ended the week on a very strong note. Witnessing a strong momentum on the upside, the market expanded its trading range as well. The Nifty traded in a range of 393.65 points during the week, closing near its high point and forming a fresh lifetime, as well as a fresh closing high for itself. The volatility dropped a bit lower; the IndiaVix declined marginally by 1.18% to 13.39 on a weekly basis. While the markets rose in almost an unabated manner, the headline index posted a net weekly gain of 412.75 points (+1.66%). The month ended as well; Nifty posted a monthly gain of 284.75 points (+1.14%).
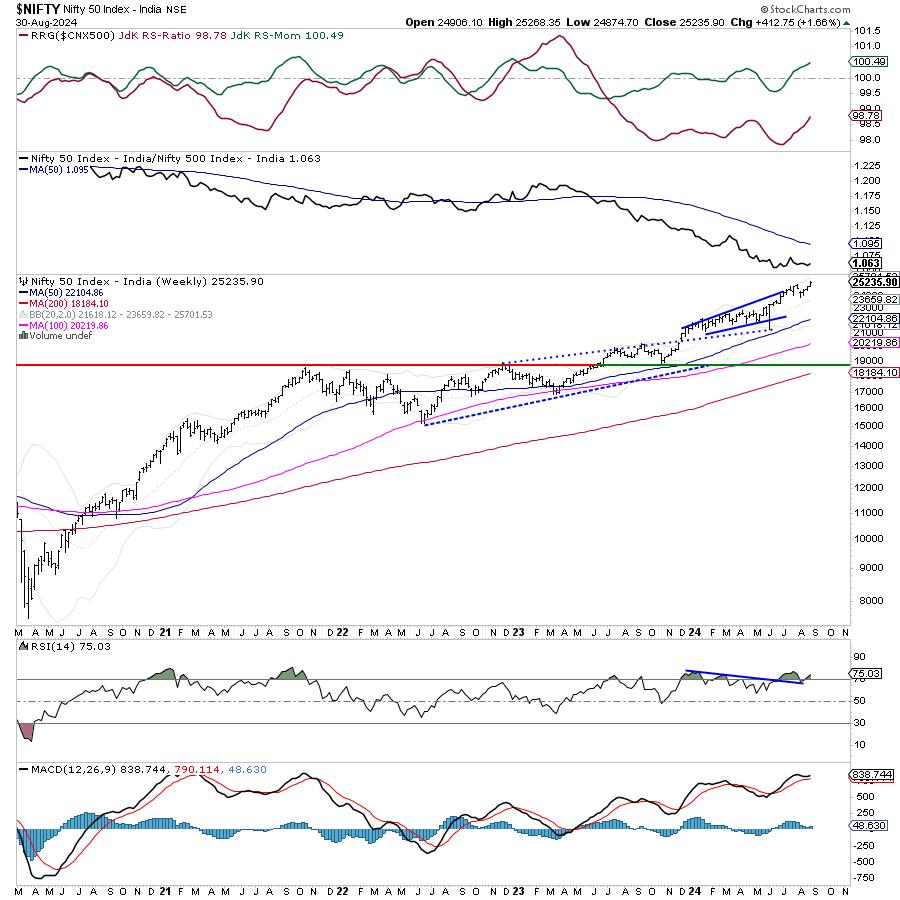
The markets are in a strong uptrend; however, once again it has created a situation wherein they have sharply deviated from their mean. This warrants a very careful approach to the markets. The nearest 20-week MA is placed at 23.659, which is 1576 below the current close. The 50-week MA, which is placed at 22104, is 3131 points below the current level. All these things point at the markets deviating from their mean once again; this leaves them prone to more volatile profit-taking bouts at higher levels. This also highlights a need for vigilant protection of profits with every upmove that may take place as we travel with the trend.
Monday is likely to see a stable start to the day. The levels of 25400 and 25495 are likely to act as resistance points. The supports come in lower at 23900 and 23710 levels.
The weekly RSI is 75.03; it remains in a mildly overbought territory. The RSI shows a bearish divergence, as it did not make a new high while the Nifty formed a fresh closing high. The weekly MACD stays bullish and remains above its signal line.
The pattern analysis of the weekly chart shows that the markets have taken out its immediate high of 25078; it is likely to continue trending higher while raising the support levels higher as well. Going by the derivatives data, the immediate short-term support has been dragged higher to 25000 levels; any violation of this point is likely to push the markets back into broad consolidation. The market breadth remains a concern; the breadth is not as strong as it should be otherwise if such strong trending moves are taking place.
All in all, there is nothing on the charts that suggests a correction in the markets. The ongoing uptrend is strong; the easiest thing one can do is to keep traveling the trend. However, at the same time, we should not disregard the fact that the markets are once again significantly deviated from their mean. It becomes all the more important that, as we follow the trend, we do it very mindfully while guarding the profits vigilantly at higher levels. It would be prudent to keep actively trailing the stop-losses, as that would help protect the bulk of the profits. The texture of the markets is a bit defensive; stocks from the PSE, Pharma, IT, FMCG, etc. are expected to do well. Overall, a selective and cautious approach is advised for the coming week.
Sector Analysis for the Coming Week
In our look at Relative Rotation Graphs®, we compared various sectors against CNX500 (NIFTY 500 Index), which represents over 95% of the free float market cap of all the stocks listed.
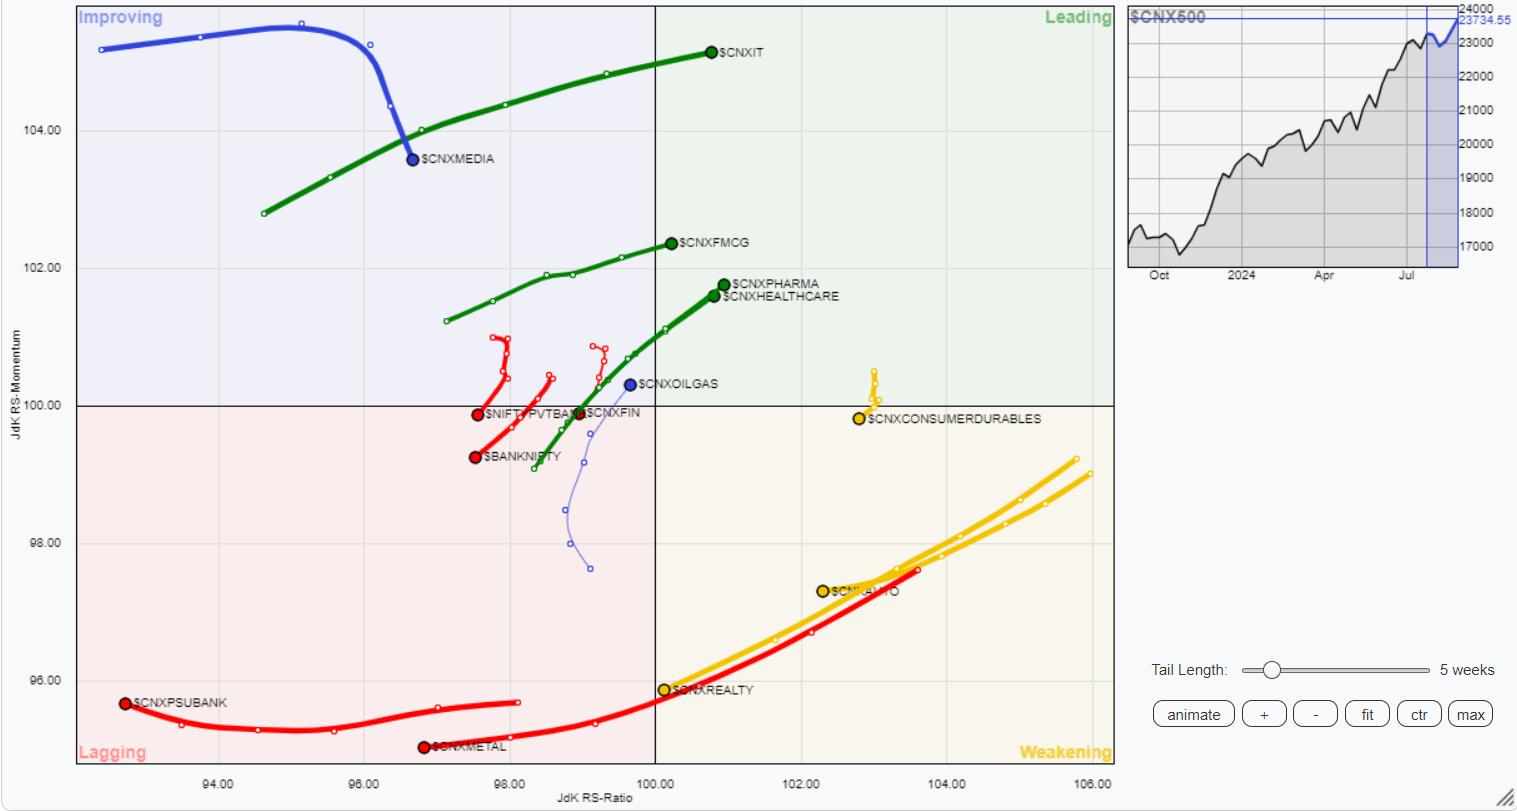
Relative Rotation Graphs (RRG) show a distinctly defensive setup. The Nifty Pharma Index had rolled inside the leading quadrant in the previous week. This week, the IT and FMCG groups have also rolled inside the leading quadrant. These groups, along with the Nifty Midcap 100 (which is seen losing relative momentum) are by and large expected to relatively outperform the broader Nifty 500 Index.
The Nifty Consumption Index, which is in the weakening quadrant, is rolling back towards the leading quadrant. Besides this, the Nifty Auto, PSE, and Realty indices are also inside the weakening quadrant.
The Financial Services index has rolled inside the lagging quadrant. The Nifty Bank Index, Infrastructure, PSU Bank, Metal, Commodities, and Energy groups are inside the lagging quadrant. Among these, the Energy, Commodities, and Infrastructure indices are showing some improvement in their relative momentum.
The Nifty Media index is inside the improving quadrant; however, it is seen to be losing its momentum.
Important Note: RRG™ charts show the relative strength and momentum of a group of stocks. In the above Chart, they show relative performance against NIFTY500 Index (Broader Markets) and should not be used directly as buy or sell signals.
Milan Vaishnav, CMT, MSTA
Consulting Technical Analyst
www.EquityResearch.asia | www.ChartWizard.ae


