 The Seasonality Action Practice blog from December 16, 2016 is about the two most impactful decisions you can make as an investor. Academics have produced stacks of papers confirming that your asset allocation decisions have immense consequences that flow directly to your bottom line. I maintain it’s the second most important investment decision you can make.
The most important decision is making a commitment to actively and regularly rebalancing your asset classes. That’s where seasonality comes in by putting the probability winds at your back as you buy and sell to realign your positions with your target allocations. The discipline decision is the most important because while seasonality has a degree of predicable probability, human behavior is predictably irrational.
Studies have shown that investors have trouble maintaining a consistent rational asset allocation. But they also have trouble selling winners while buying losers. This is exactly what we are practicing to do here, albeit using seasonality to sell winners into seasonal strength and buy losers into seasonal weakness.
This Action Practice is more about going against the herd rather than any difficult technical charting concepts. Technically, the steps are straightforward.
- XLU, XLP, XLI, XLK: your portfolio of four (4) sector equities began the year with $25,000 in each (25%) for a total of $100,000.
- By year-end (for the blog data dated Dec. 14, 2016), your portfolio has grown to $114,250 and XLU accounted for 25.3% ($29,000), XLP was 23.2% ($26,500), XLI was 26.7% ($30,500) and XLK was 24.7% ($28,250).
- Rebalancing to return each sector to 25% would mean holding approximately $28,500 in each equity.
- For XLU (valued at $29,000). we must therefore sell $500 to achieve our target of $28,500. Using the seasonality dated charts from the blog, we would sell into the annual strength of January, February or March. October historically has been more consistently up, but there’s no need to wait ten months.
- For XLP (valued at $26,500), we must buy $2,000 to achieve our target of $28,500. A review of the seasonality months tells us to buy in January which traditionally has been weak. Don’t procrastinate as February has been “traditionally” strong 100% of the time over the past five years.
- With XLI, we must sell down to $28,500 from our present $30,500. If you rush to sell in January, you’ll be selling into historical weakness. Why not wait until February or March to sell into historical strength?
- XLK is just $250 below our target allocation. January is historically a weak month, so buy now and don’t put if off until February or March as XLK historically gets stronger.
A corollary to this exercise is the statistical importance of asset allocation. Using the nine (9) sectors as an example of how returns do indeed vary over time, here are the drawdowns in percentages of various sectors during two bear markets:
- March 22, 2000 — March 11, 2003:
Financials were down -4.94% and Technology was down -78.14% - Oct. 7, 2007 — March 9, 2009:
Financials were down -76.18% and Consumer Staples were down -31.28%
Diversification and prudent asset allocation that considers correlation co-efficients between asset classes will over time both preserve capital (during bear markets) and grow capital (in bull markets).
As I said earlier, this is not complicated stuff. It’s the discipline to execute a rational asset allocation strategy that pays big dividends. Check out our Asset Allocation DVD for an in-depth seminar on this high leverage topic.
https://store.stockcharts.com/collections/dvds/products/how-to-master-your-asset-allocation-profile
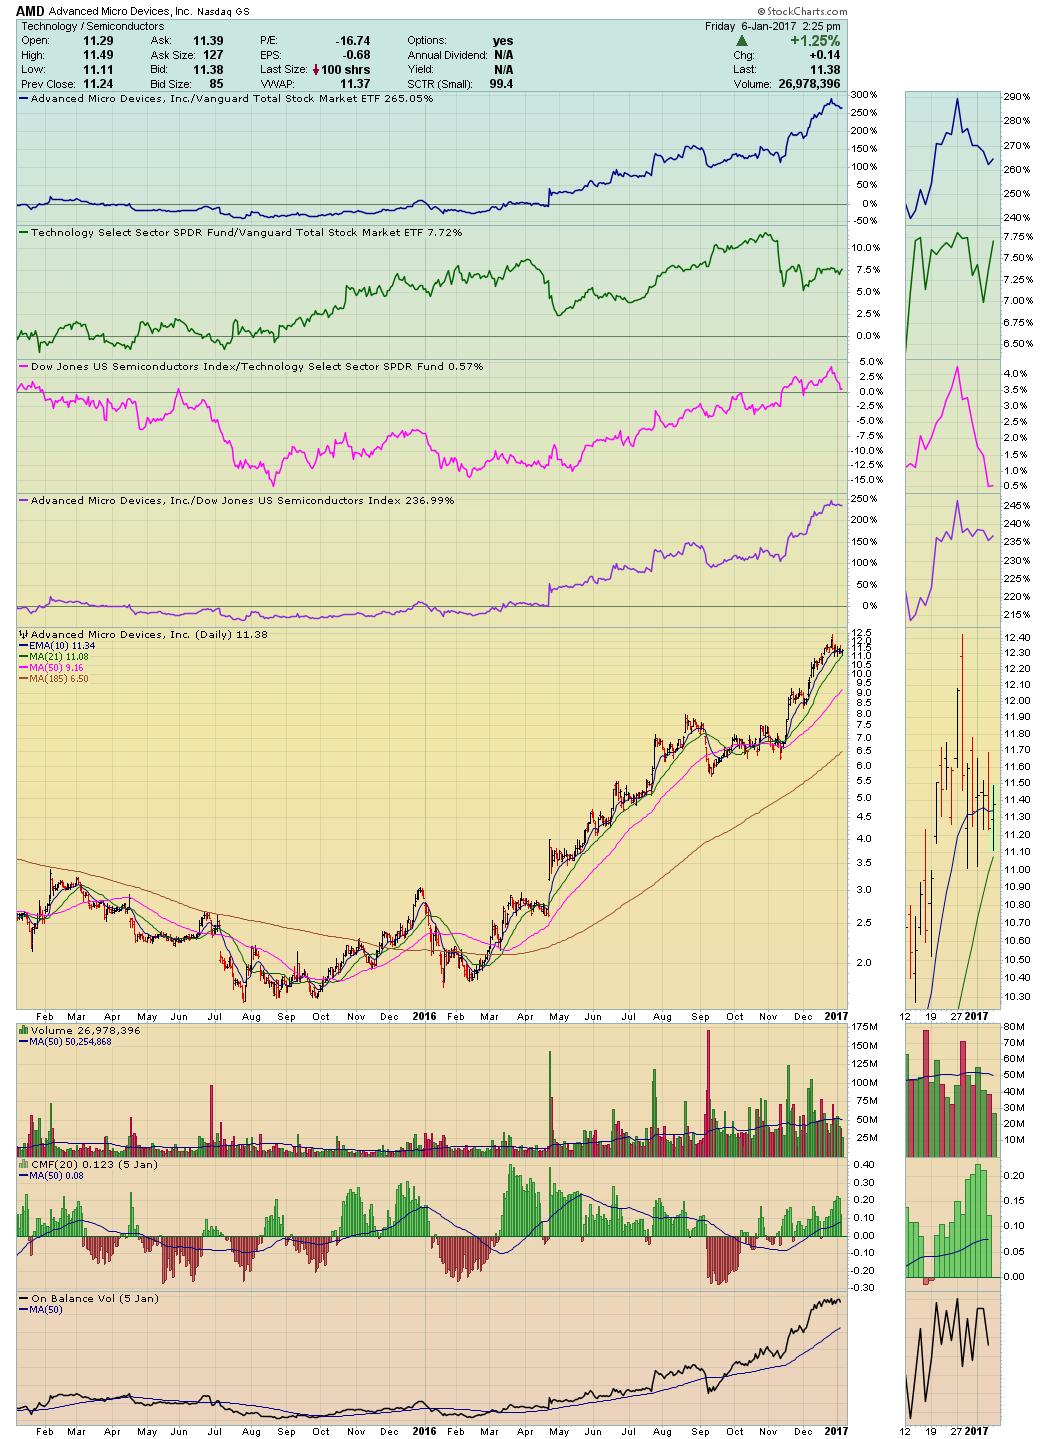
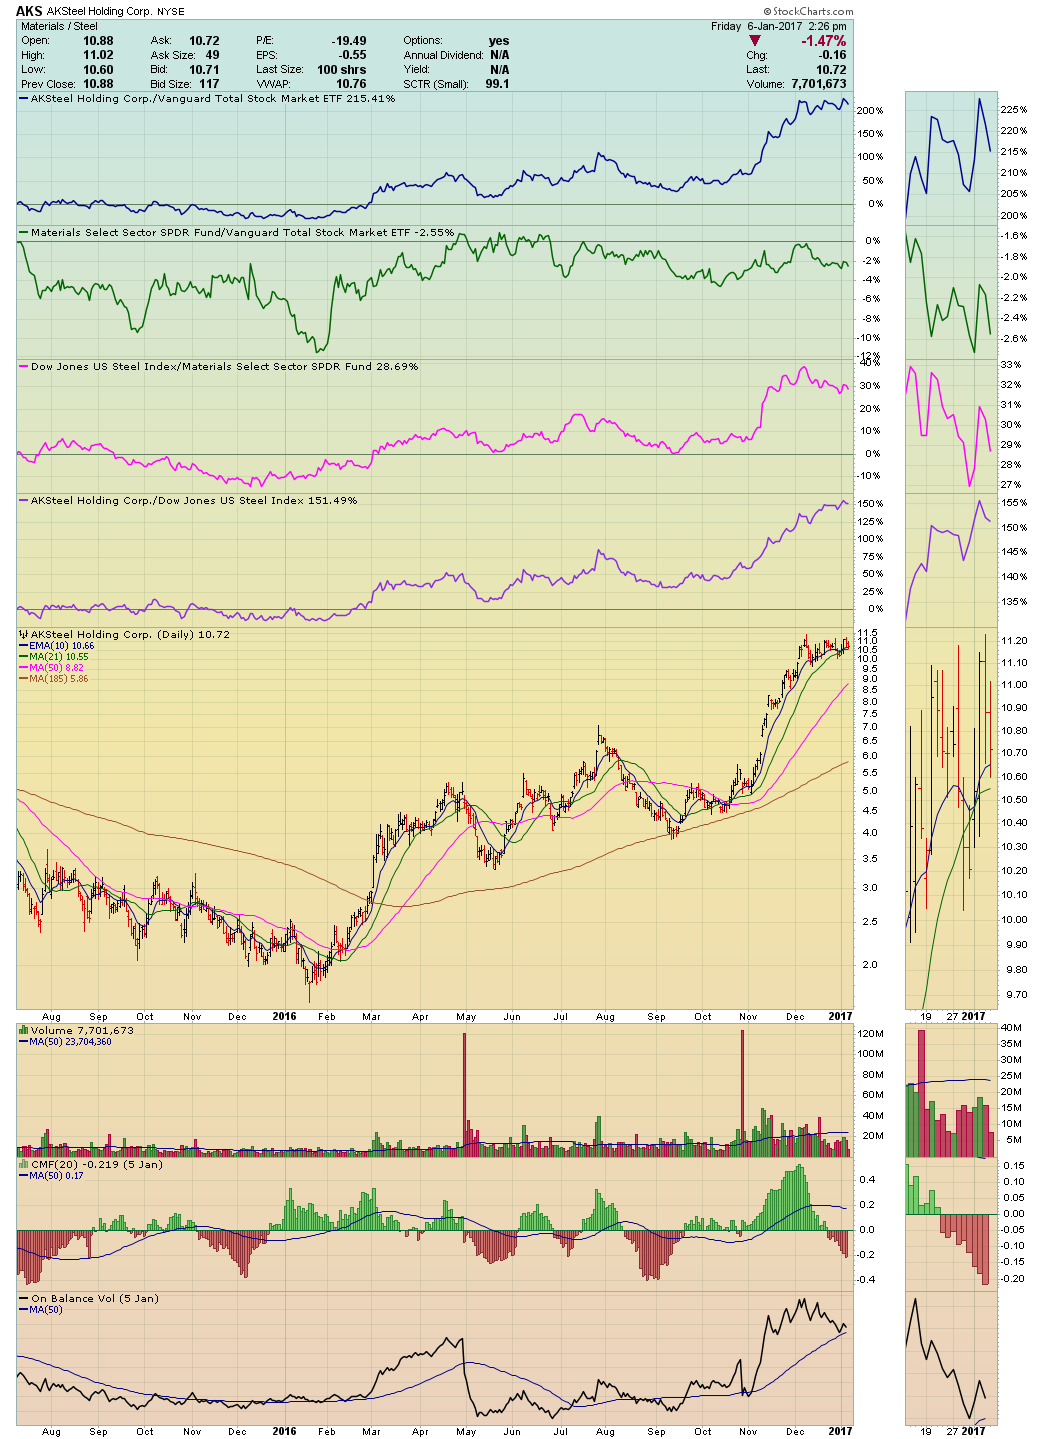
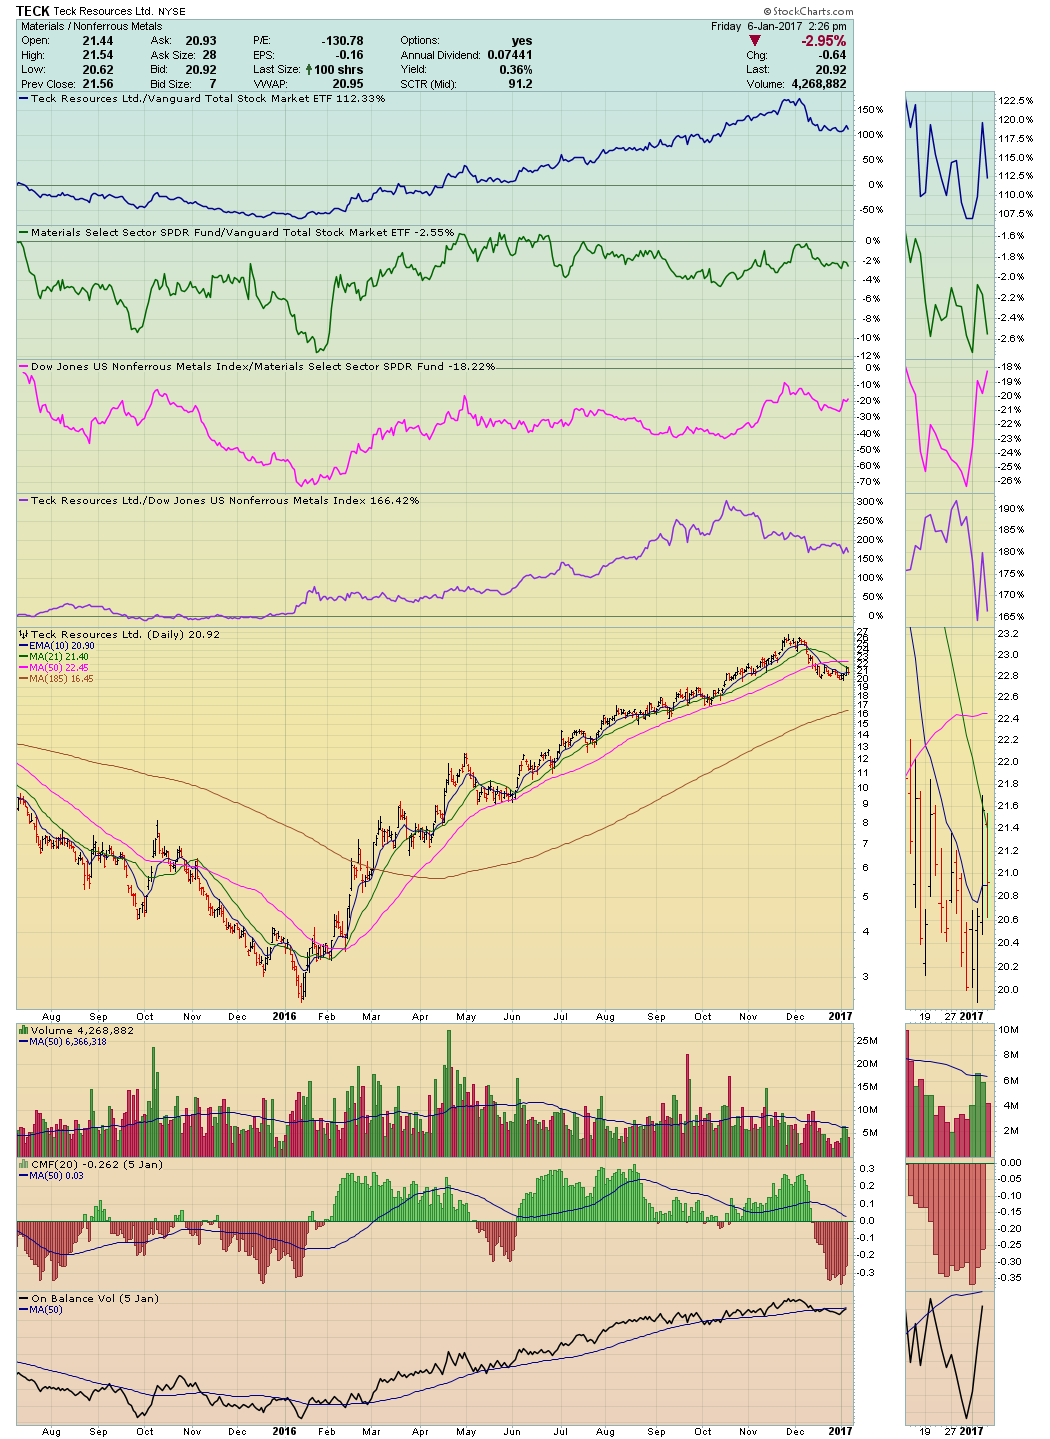
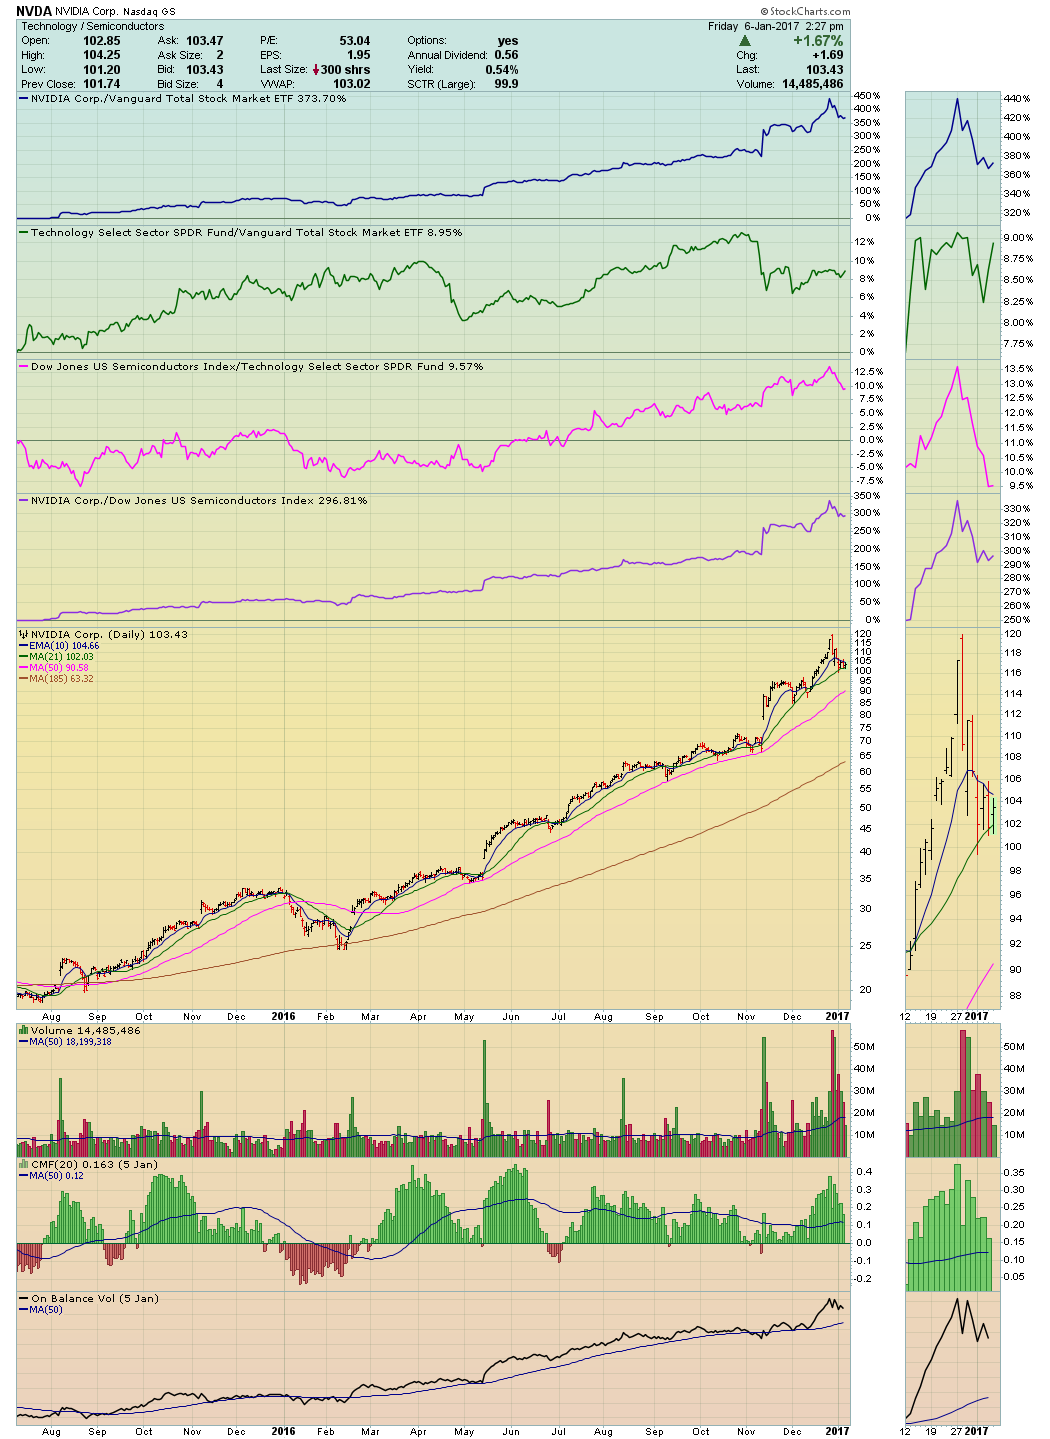
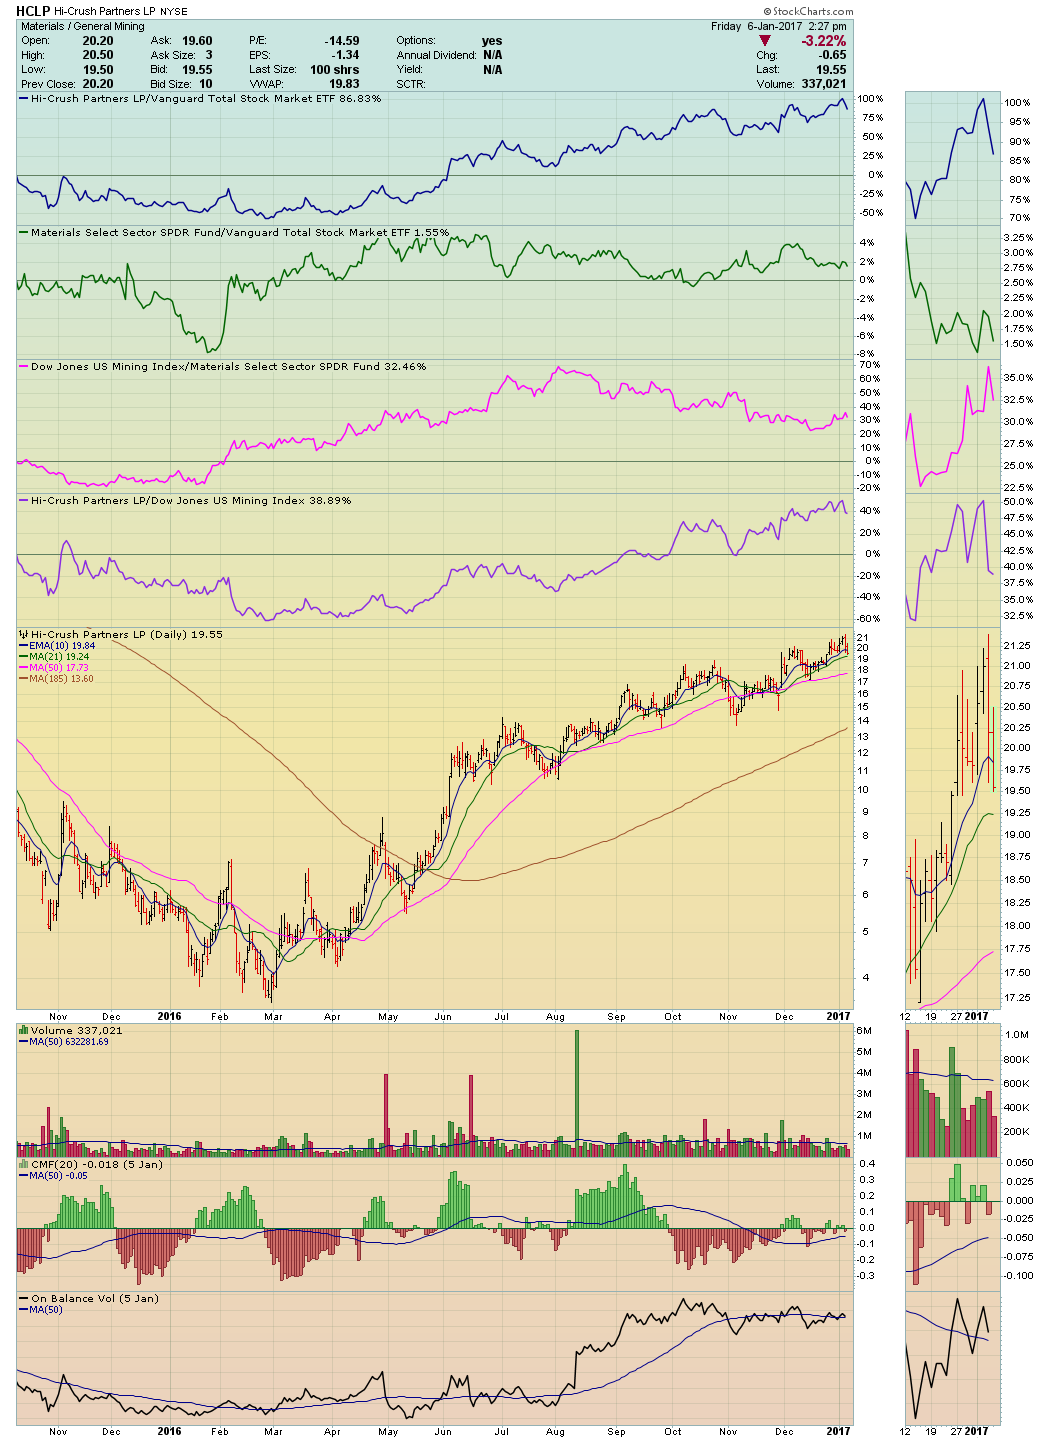
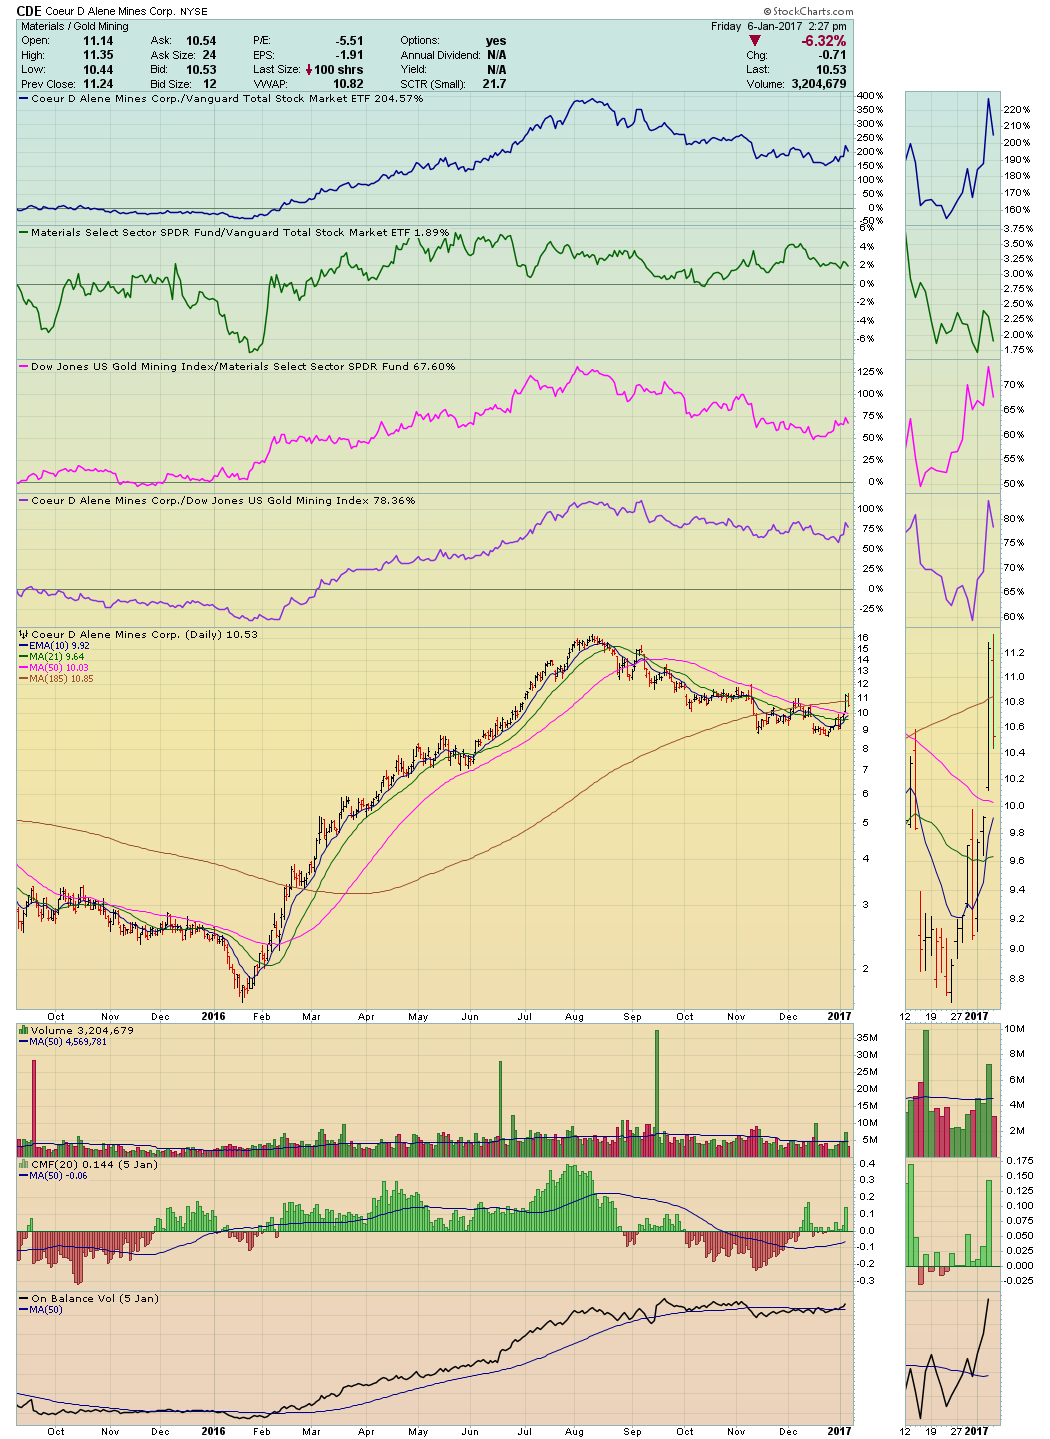
This week’s Action Practice exercise reviews some of the best equities from 2016 in order to understand how they setup prior to their extremely profitable runs. Our Tensile Trading methodology is based on the fact that the stock market operates on the “Law of Groupings”. If you consistently buy equities that are in the strongest sectors, in strong industries outperforming their sectors and finally pick the strongest stocks in those favored industries, you should achieve extremely enviable results. If you layer atop of that a money flow analysis, you’ll have something special.
Note: This exercise is focused on using the Tensile Trading methodology for timing purchases. We’ll do another Action Practice in the future focused on how to use the Tensile Trading methodology on the sell side. For those more motivated students of the market, after you do the buy-side exercise, you might wish to look more closely at Coeur D’Alene (CDC) in August - September as to sell side clues.
The Tensile Trading chart style is available to you pre-formatted in the pull-down menu “ChartStyles” — select “Predefined Setting” and then “Gatis Roze”. Your role with this exercise is to draw a vertical line (your Buy Point) on each chart when you feel you have adequate information to place a buy. Consider the relative strength trends for each of the grouping charts, as well as money flow.
Trade well; trade with discipline!
- Gatis Roze, MBA, CMT
- Author, Tensile Trading: The 10 Essential Stages of Stock Market Mastery (Wiley, 2016)
- Presenter of the best-selling Tensile Trading DVD seminar
- Presenter of How to Master Your Asset Allocation Profile DVD seminar
- Developer of the StockCharts.com Tensile Trading ChartPack
