 So you’ve heard about Exchange Traded Funds (ETFs). You’ve heard that they are cheap. You’ve heard that mutual fund managers cannot outperform ETFs. You’ve decided that a chunk of your nest egg should be in Healthcare. A friend suggested XPH because it holds stocks like Eli Lilly, Merck and Johnson & Johnson — companies you’ve heard of. Buy, Buy, Buy!! Whoa — slow down, partner.
Action Practice #15 was about exactly this scenario. I presented you with six options from which to choose. Yes, these six are all Healthcare ETFs, but a closer examination will point out that they are vastly different creatures.
The six candidates were XLV, IXJ, IYH, XBI, XPH and VHT. There are infinite ways to research these ETFs. Here’s the step-by-step process that I suggest.
STEP ONE:
ETF.com is a free website that offers detailed summaries. Start here.
- Historically, XLV is the dominant ETF in the Health Care segment. If you start with XLV, their data sheet will also list “top competing ETFs”. Explore other options. Not all ETFs are created equal even when their names imply they are the same.
- Draw up a simple matrix of these six candidates. When you do, certain facts will jump out at you.
- Expenses range from .10% up to .47% (lower is better for you).
- Asset size ranges from $16 Billion down to $445 Million (bigger is generally better — lower fees and easier liquidity).
- Daily volume, average bid/ask spreads and median premium/discount to Net Asset Value could all cost you money, so consider these in your comparison.
- Consider the concentration of assets in the top 10 equities. Most of these six ETFs are in the 40-50% range.
- Ask yourself if you are more comfortable with 38 total holdings (XPH) or 357 equities (VHT) in the ETF you buy.
- Did you want just North American equities? Or are you comfortable with global exposure? Over 30% of IXJ equities lie outside of North America.
- Check out the underlying index that each ETF follows. They are all different. Also, most all use a market cap weighting scheme. XBI uses an equal weighting scheme — know which you prefer.
- Don’t forget to consider dividend yields. XLV = 1.51% annually. XBI = 0.16% annually. Are you looking for some income?
- Note that the majority of these ETFS have over 75% invested in giant and large healthcare corporations, whereas XBI has only 20% there and over 60% in medium and small caps. (Personal note: this makes sense since XBI is a biotech fund which should be focused in this portion of the market. I own it specifically for that reason.)
STEP TWO:
For myself, the next step in the investigative process is to load the top 5 candidates into Schwab’s “Compare” tool. (Most other brokerages have something similar in their customer research tool chests.) This produces a wonderful side-by-side comparison of (a) facts and fees; (b) performance; and (c) portfolio holdings.
This also provides an alternative second opinion to my personally-designed matrix which I populated with data from ETF.com in step one. It confirms and reinforces my observations and produces other useful insights. Here’s one example. Although XBI (Biotech) has outperformed XLV (SPDR Healthcare) in all timeframes (1-year, 3-years, 5-years and 10-years), the volatility road it took to get there was very bumpy indeed. This makes sense when you understand that these two ETFs are as different as apples and kumquats. Many investors need to understand that they might not have the stomach for such volatility despite the performance numbers.
STEP THREE:
The next step is to install all six candidates on a Perf Chart. This sounds straightforward, but I challenge each investor to understand his or her own investment time horizon before getting pulled into conclusions which are not personally appropriate.
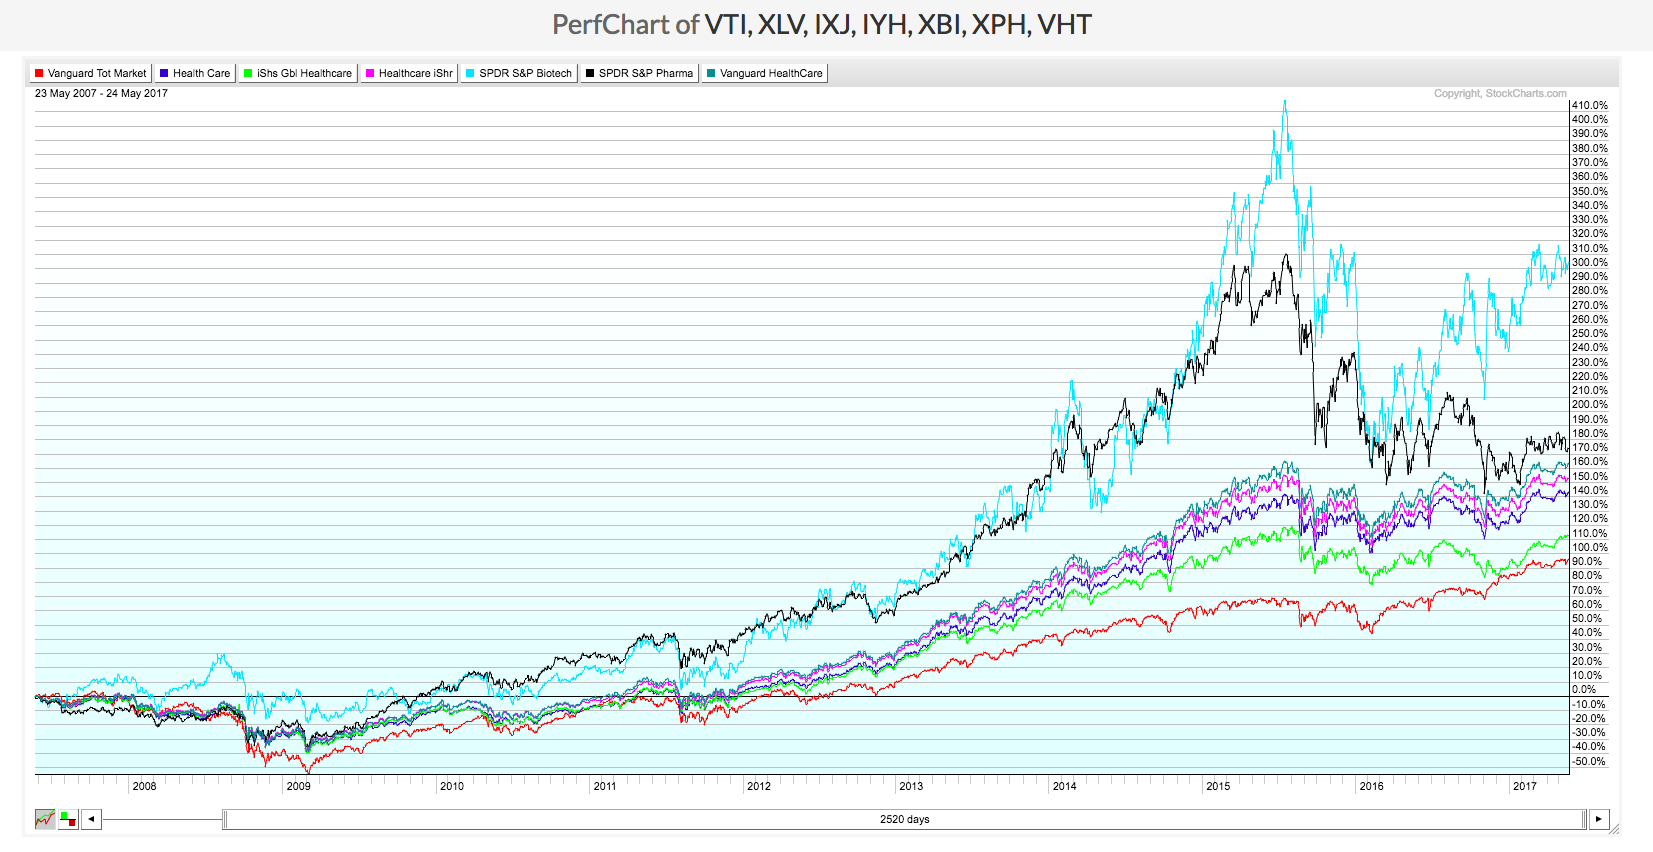 I’m using 10 years in my example.
- The good news is that all our candidates outperformed the Vanguard Total Market ETF (VTI). This just reinforces my often repeated sermon that asset allocation decisions are worthy of your time and attention.
- The two industry specific ETFs (XBI and XPH) outperformed the healthcare sector, but again note the volatility and ask yourself if it’s right for you.
- For a host of reasons, my preference amongst the remaining four candidates is Vanguard Healthcare (VHT).
STEP FOUR:
After that extensive research exercise, I have one more step. I maintain what I call “Best of Breed” PerfCharts for all the 20 asset classes in which I am personally invested. Step Four seeks to metaphorically place the best ETFs in the ring with the best mutual funds , and then let them fight it out for the “Best of Breed” title. Of course, the fees charged by active mutual funds must be justified by their out performance.
In some asset classes, I do find these exceptional mutual fund managers, and I own their funds. In other asset classes, I am more comfortable with ETFs. Not so as you can see for my Healthcare Asset Class.
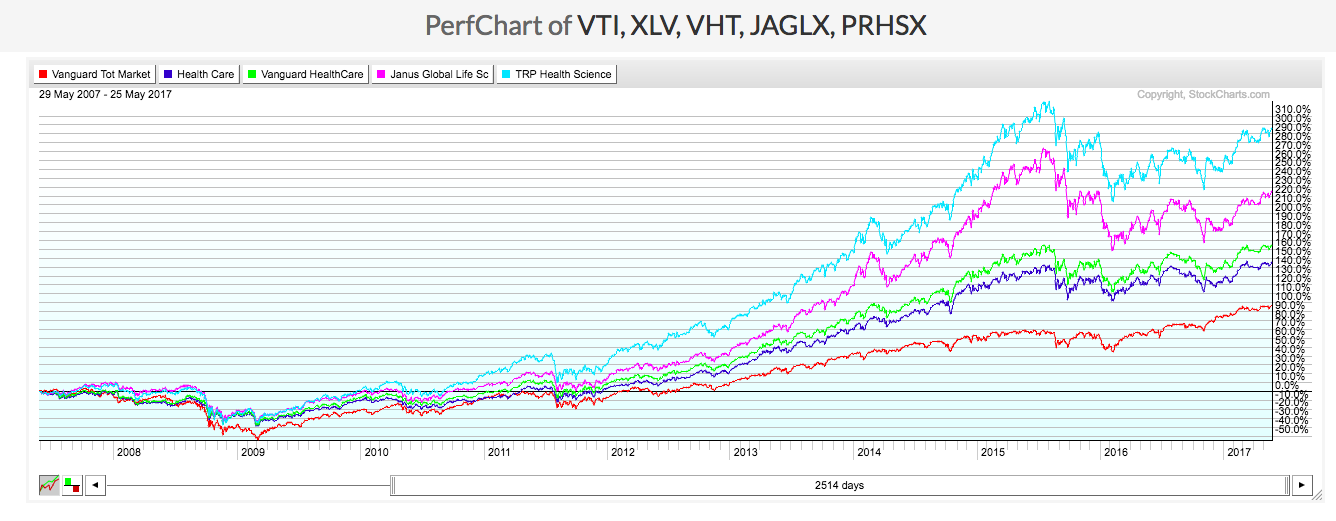 Both my actively managed mutual funds (JAGLX and PRHSX) have outperformed their ETF challengers, and hence these funds get to be crowned as “Best of Breed” for my healthcare asset group. Yes, their expenses are higher than XLV and VHT, but their outperformance justifies this.
CONCLUSIONS:
- The oldest or largest sector ETF is not necessarily your best choice for an asset class you need.
- Know what you personally are more comfortable with. An ETF with 61 equities (XLV)? Or one with a broader assortment of 357 equities (VHT)?
- Higher expenses and trading spreads matter. This money comes right out of your pocket.
- As I wrote in my May 19, 2017 blog, far too many lethargic investor portfolios today are full of ETFs because these folks prefer lazy investing. This is an approach that will cost them dearly over the years. If you are a lazy investor, you’ll get lazy performance. You can get away with some lethargic investing tendencies, but I urge you to put in the work upfront. It will be worth it.
- I have found that maintaining “Best of Breed” performance charts for all 20 of the asset classes in which I invest makes it super easy to consider and compare new candidates to existing champions. Nothing is cast in concrete or buy and hold forever. I strongly suggest you try this approach yourself.
- So after all that analysis, my personal portfolio owns mutual funds for my healthcare asset class — and an ETF (XBI) for my Biotech asset class. Yes, in my portfolio, these are two separate asset classes despite some overlap.
This Week’s Action Practice:
My blog from last week (3-Prong Recipe — May 19, 2017) was reprinted by a number of investment websites, including MarketWatch.com. In it, I described my Core, Explore and Super Explore approach to building a portfolio that is safe, yet also provides outperformance and growth.
http://stockcharts.com/articles/journal/2017/05/my-3-prong-recipe-for-the--safe-growth--outperformance-of-your-portfolio.html
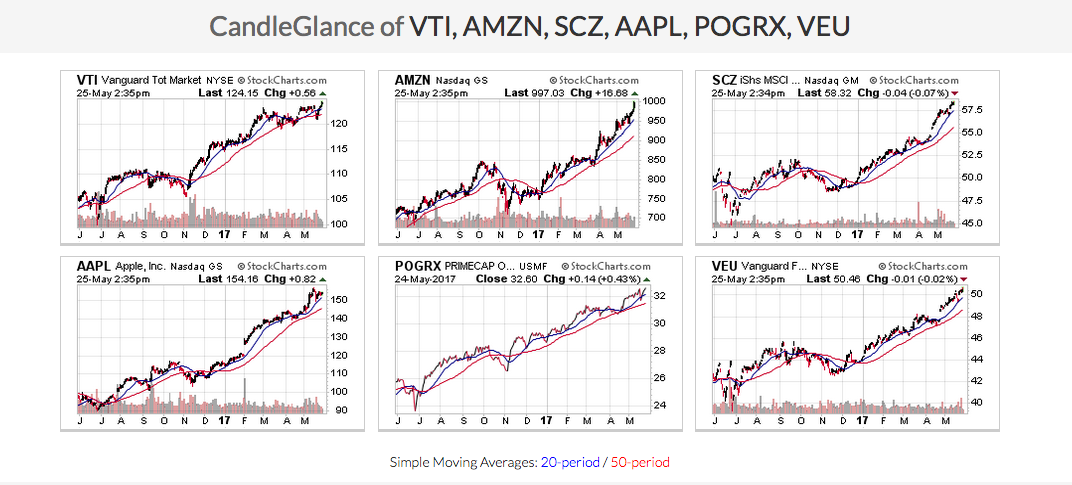
The challenge this week is to think in terms of the 3-Prong Recipe and assign the charts below to one of the three portfolios. This should reflect more of your own personal risk tolerances than any “solution” I might present to you. In other words, it is less about right and wrong. It is more about what is comfortable and personally appropriate for you.
Your first task is to understand the unique nature of the investments in each of the three categories. John Bogle (founder of Vanguard) calls them “Core & Explore”. I’ve added a more aggressive third category to seek growth.
Consider the following six equities as your portfolio and decide which are most appropriate for each of the three categories: (a) CORE; (b) EXPLORE; and (c) SUPER EXPLORE.
Trade well; trade with discipline!
- Gatis Roze, MBA, CMT
- Author, Tensile Trading: The 10 Essential Stages of Stock Market Mastery (Wiley, 2016)
- Presenter of the best-selling Tensile Trading DVD seminar
- Presenter of the How to Master Your Asset Allocation Profile DVD seminar
- Developer of the StockCharts.com Tensile Trading ChartPack


