 Imagine a football coach who has the best eleven quarterbacks in the NFL altogether on the same team and puts them on field at the same time. This “dream team” would get clobbered. Without tight ends, tackles, guards, wide receivers and a center there to present a balanced attack, there would be no hope of victory. So why do so many investors build a team of assets that does precisely the equivalent of a team with 11 quarterbacks? With this sports analogy and some further elaboration, I’ll prove to you the importance of diversification and strategic correlations.
On the other hand, if you could hypothetically draft the best player for every individual position and then put them together on one team, I’ll bet you’d win the Super Bowl. At the very least, you’d have a high probability odds on favorite. You’d certainly have no risk of finishing in the lower half of the NFL!
Of course, if God forbid the team plane crashes, then all bets are off. That would be something akin to the once-in-a-lifetime meltdown that we had in 2008 when everyone’s portfolio was damaged to some degree. But we’ll discuss this scenario a bit later.
Barring a total apocalypse, diversification which deploys strategic correlations means strength, safety and risk reduction through variety. The individual pieces (be they assets or NFL players) all act slightly different with the result being that the whole becomes greater than the sum of its parts. Yes, read that again. Diversification without correlations is naive.
Let’s look at another arena and dig a bit deeper to understand how Ivy League college endowments utilize these strategies to produce results of which most investors can only dream. To do this, we must understand the basics of the tools in their arsenals. First, they do not rely on intuition or random asset picks to build their portfolio. They utilize two killer not-so-secret weapons: diversification and correlation. Let me explain.
The correlation coefficient is a single number that indicates how two assets have behaved historically in the same setting over a specific period of time. If one asset (stock, ETF, mutual fund, etc.) goes up every time the other asset goes up — and they both go down together to the same degree as well — then they have a correlation of 1.0. This is a perfect positive correlation (something seldom seen in the real world).
Conversely, if they move in opposite directions together all the time, the two assets would have a correlation of negative 1.0 (i.e. -1.0) which is a perfect negative correlation. (In the real world, correlations usually lie somewhere in between these two extremes of perfectly positive and perfectly negative.) Finally, if the two assets show no relationship whatsoever in movement, then they have no correlation — a correlation of zero.
In utilizing correlations, investors have to make two decisions. First, they must pick the two assets to compare. Then, they must pick the historical look-back period upon which to calculate the correlation. This numerical statistic is so important because a portfolio of many assets does not yield the benefits of diversification if all the assets have a correlation near +1.0 to each other. In other words, if you have a team of all quarterbacks.
This is why college endowments seek to populate their portfolios with alternative assets that provide them exposure to different return patterns, different risk levels and volatility, as well as a wider spectrum of correlations amongst all their asset classes. Their correlations actually gauge just how diversified their portfolios truly are. Their other objective is to dampen the volatility of their portfolio returns. They don’t want a bumpy ride because smooth is always better than choppy.
Yes, steadier returns make everyone feel better. But mathematically, the magic of compounding is much friendlier to steady returns than to more volatile returns. (The numbers, proofs and calculations for that statement are best left to a blog for another day. For now, just trust me on this.)
The bottom line is that even during the extraordinary financial crisis of 2008, the top-tier academic endowments protected their portfolios from mass destruction by their broad strategic diversification and carefully selected low correlating assets.
The rebuttal that I’ve heard from some investors is that they use market timing instead. Trying to time the cyclical outperformance of various asset classes is messy at best because we are our own worst enemies. Remember that the embodiment of logic and behavioral consistency is Spock from Star Trek — and afterall, he is a fictional character.
Now back to the sports metaphor. Not only did our Super Bowl contender draft the “best-of-breed” football players for each and every one of the eleven positions, but the team applied mathematical correlations amongst all the players. In essence, they considered each player’s strengths and weaknesses with respect to the strengths and weaknesses of every other player based on every game played over, let’s say, the past five years. Then, they populated the field with the best player for position X, taking into account the other ten players on the field at the same time and how they had played in unison with position X over the past five years.
Call it synergy. Call it strategic thinking. I’d call it essential money management discipline of which all individual investors should take advantage. It’s okay. There’s nothing wrong with copying the pros. We all aspire to be that Super Bowl contender.
To present a visual example combined with individual correlation coefficients, please review the PerfChart below. It shows five years of price behavior for two stocks, two ETFs and one mutual fund versus the S&P 500.
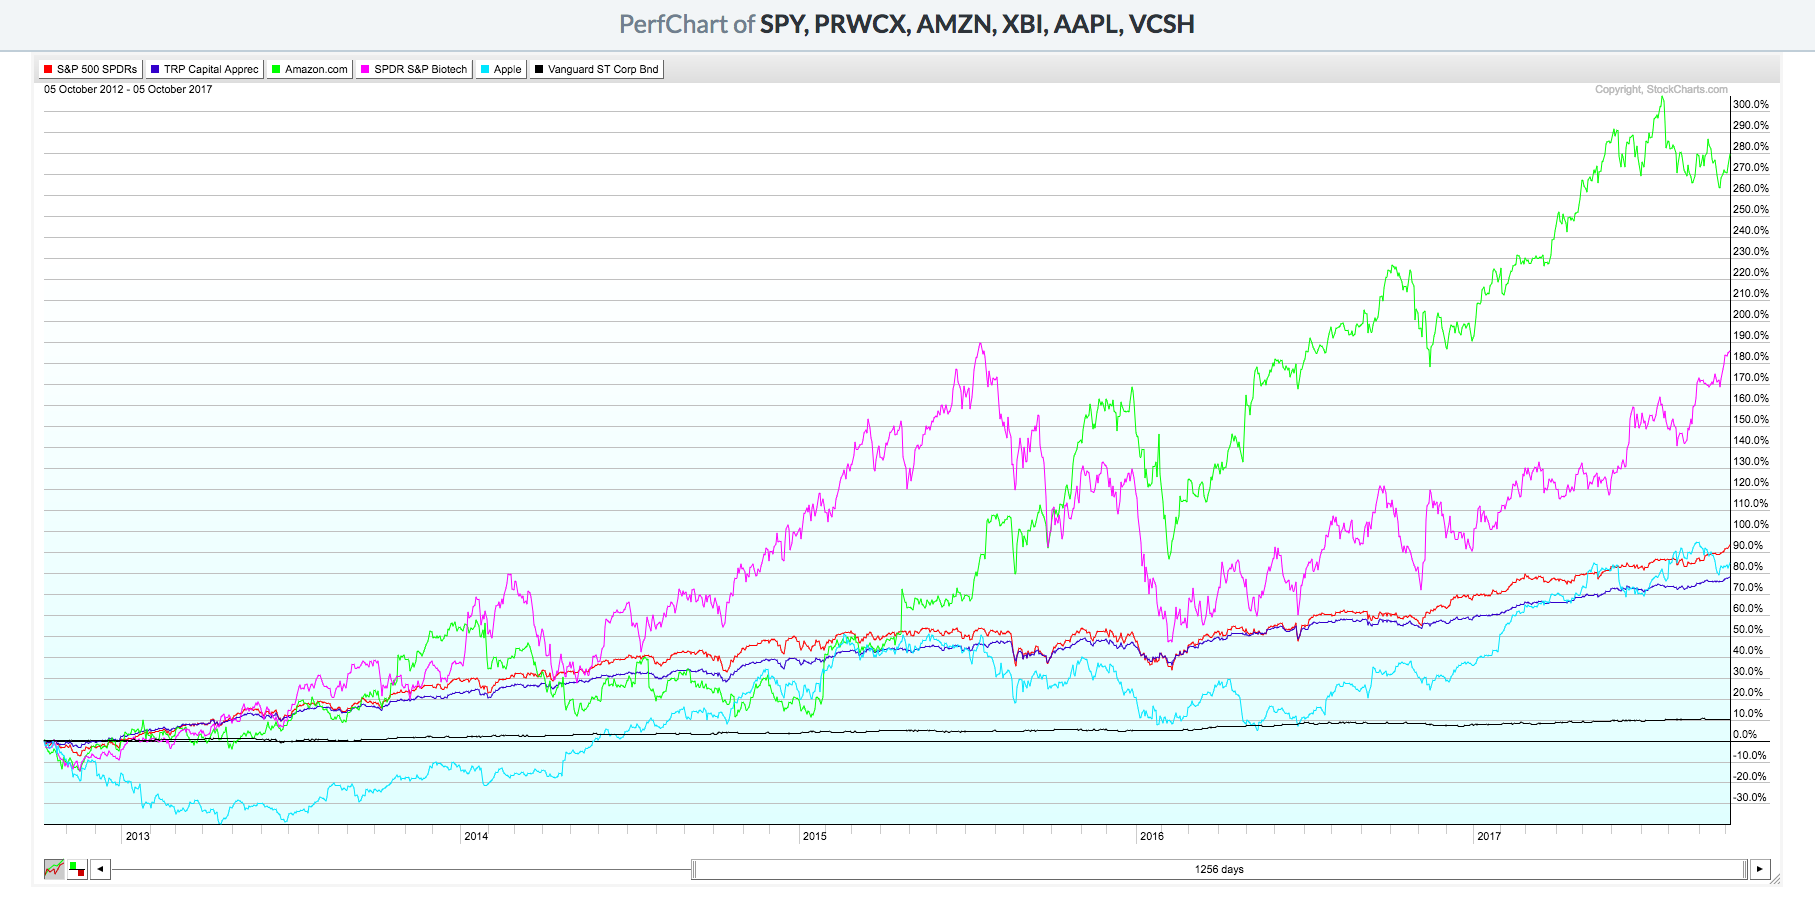 You could try to do a visual guess of the correlation coefficient for each, but I prefer the consistency of the mathematical correlation.
These then are the five-year correlations for each ticker relative to the S&P 500 (SPY):
- T. Rowe Price Capital Appreciation Fund (PRWCX) 0.95
- Amazon (AMZN) 0.53
- SPDR S&P Biotech ETF (XBI) 0.53
- Apple (AAPL) 0.49
- Vanguard Short-Term Corporate Bond (VCSH) 0.17
In conclusion, you, too, can now build a Super Bowl Championship portfolio, but it requires careful diversification and strategic correlations to produce the winning team you desire. Remember this: “markets are only lived forwards, but only understood backwards.” (Steven Romick)
P.S. The really exciting news is that StockCharts.com now enables you to calculate the correlations for an entire ChartList of your choice. This alone is worth the “price of admission”.
Trade well; trade with discipline!
- Gatis Roze, MBA, CMT
- Grayson Roze
- Author, Tensile Trading: The 10 Essential Stages of Stock Market Mastery (Wiley, 2016)
- Presenter of the best-selling Tensile Trading DVD seminar
- Presenter of the How to Master Your Asset Allocation Profile DVD seminar
- Developer of the StockCharts.com Tensile Trading ChartPack


