 Once again, a big shout-out to our Tensile Trading ChartPack User community. This has become a sensational crowd-sourced collection of the best-of-the-best charts and ChartList organization. We’re all profiting handsomely from improving this collaborative investing tool. Don’t be bashful. We invite you to be a “commentariat” as well. Send us your suggestions!
It’s been said that to become a consistently profitable investor requires “extravagant preparation” over years. I maintain that it can be a lot easier than it sounds and over a much shorter time period. Yes, the art and craft of successful investing means you must learn to make good choices and not chase your impulses. But it is equally essential to have a dependable organized roadmap (i.e.ChartPack) and, of course, the discipline to allocate the appropriate mindshare on a regular basis. With that, we invite one and all to join our powerful investing ecosystem.
Here are brief descriptions of just some of this quarter’s enhancements and betterments, as well as the many fresh actionable insights from our X-ray analysis of all the Fidelity Select Sector Funds.
#10.4 — Bullish & Bearish Dashboard
Since we first made our personal ChartLists available to StockCharts subscribers in 2013 and through 23 subsequent upgrades, the ChartList that’s been commented upon the most is this one. In simplistic terms, it’s a market timing dashboard based on history. It’s been winnowed down strategically into a collection of the fifteen most powerful long term indicators. Investors vote with their portfolios either being bullish or bearish or someplace along that spectrum. These fifteen charts let you decided based on your own investing timeframe. We encourage all the investors in our ChartPack community to review these charts regularly.
As we write this update, there are no bearish charts. There are four charts that we might suggest you review:
- Chart #4.15 — The Fed Funds Rate is going flat.
- Chart #4.4 — Industrial Production had a pullback but has ticked up again.
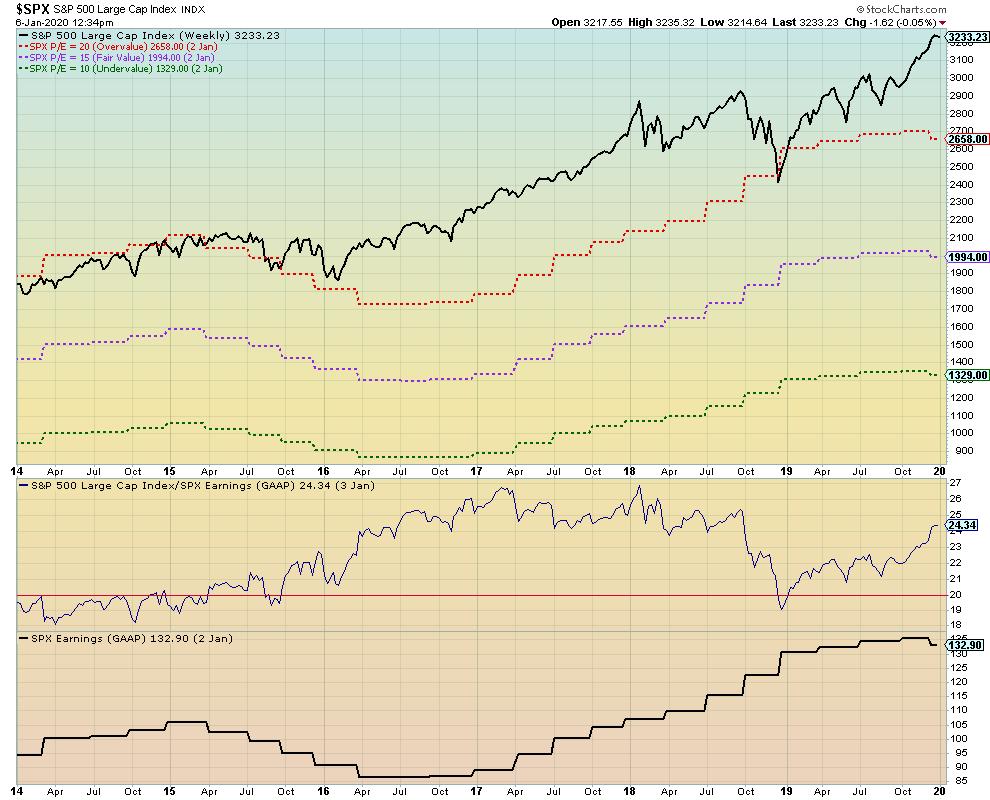
- Chart #4.5 — The S&P 500 Earnings is still trending up, albeit momentum is decreasing.
- Chart #4.7 — The Average True Range is increasing and presently trending up.
A reminder: read the extensive notes that are beneath each chart and available in four different views.
#400-1 —Sectors / Percentage New Highs Less New Lows
If investors leaned exclusively on the ChartPack simply for Sector SPDR analysis and insights, it would pay for itself in a week. Sensational stocks in great industries won’t necessarily make you money if they occur in an out-of-favor sector. On the other hand, being invested in the sector that’s outperforming — even if the industry group and stock is lukewarm — can still put money in your pocket. It’s all about probabilities.
Our point is that first and foremost you have to nail your sector dissection. This is the entire foundation of our Tensile Trading high probability investment methodology. In an uptrending market, pick those stocks that are doing three things: (a) in a sector that’s outperforming the market (VTI — the Vanguard Total Index); (b) in an industry that is outperforming its sector; and (c) is the best-of-breed stock in its industry. In other words, you want a stock that is outperforming its brothers and sisters within its industry. A present example of this might be Inphi Corporation (IPHI).
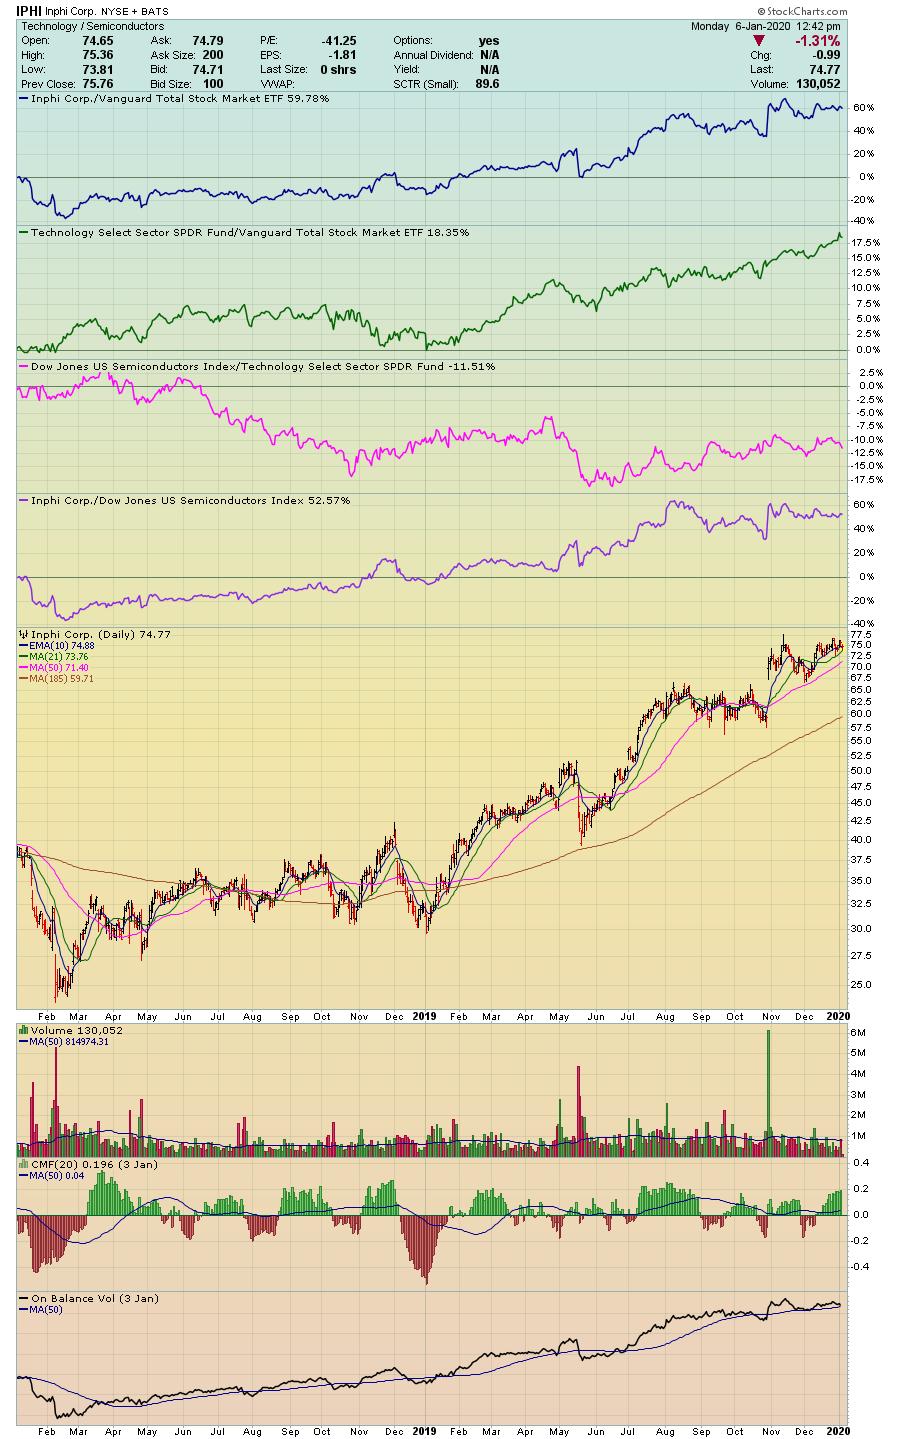
But remember, it all starts with sector analysis.
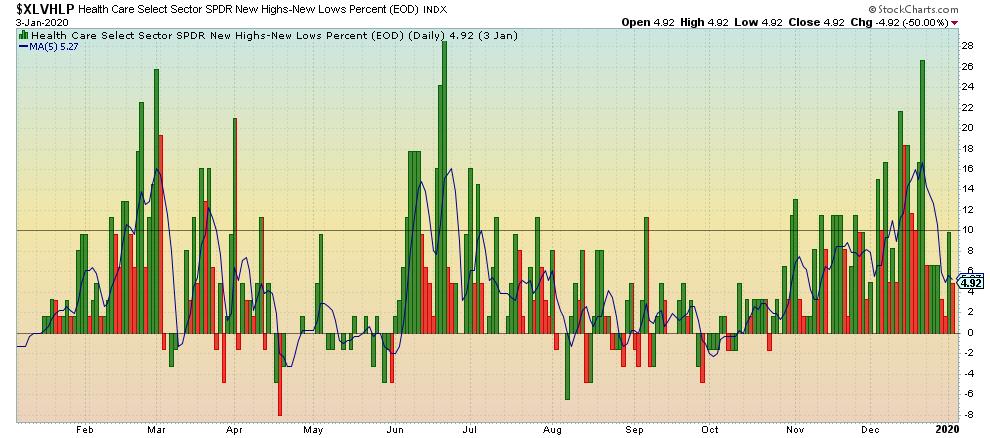
This new ChartList is populated with twelve charts. They clearly show the underlying strength of all eleven sectors and the S&P 500 by plotting the percentage new highs minus percentage new lows. We’ve plotted them as Histograms and installed horizontal reference lines at +10 and -10 to make comparisons more visually powerful. We feel that the blue 5-day simple moving average line also makes comparisons easier. We look closely at these charts once a week and rank them by percentage change in the summary view. We also like to take note of whether the sector is outperforming the S&P 500 or underperforming.
#420 —Fidelity Sector Funds
By now, most readers grasp the significance of sectors as the bedrock of successful investing. In other words, you can pick the wrong equity, but if it’s in the right sector, you can still make money. Reinforcing this principle, we’ve added three Sector funds to the Fidelity Sector nest. Therefore, you’ll see that ChartList 420 — the master — now has three new sector funds bringing the total to 43. The new Sector Funds are:
- Global Commodity Fund
- Real Estate International Fund
- Real Estate Income Fund
Correspondingly, all three have their own ChartLists as well that contain their top holdings. Note that the Real Estate International Fund’s holdings are mostly private equity deals with only a few being publicly traded, such as Prologis, Inc. and Mitsubishi Estate Co.
#640 —Institutional Dividend Darlings
This ChartList has three parts. It’s populated with (1) four of the top dividend growth and appreciation mutual funds; (2) four of the largest and most liquid dividend focused ETFs; and (3) fourteen of the individual stocks that are most widely held by both groups — the mutual funds and the ETFs (as of April 19, 2019). The stock charts show both the dividend payments on the timeline, as well as their respective yields. This ChartList has it all — whether you are looking for solid dividend stocks, passive dividend ETFs or actively-managed dividend appreciation mutual funds.
Fidelity Select Sector Funds
The paramount focus of our tracking the Fidelity Sector Funds buys and sells each quarter is to monitor their accumulation and distribution of specific equities. While that continues to be our focus and where many profitable trades originate, don’t overlook other powerful insights. For example:
- Percentage return this past month exceeded 12% for Gold (FSAGX) and Semi-Conductors (FSELX) and it exceeds five percent for Health (FSHCX), Tech (FSPTX), Computers (FDCPX), and IT Services (FBSOX).
- For the top five funds over a slightly longer timeframe, the percentage return over the past three months is 6-8% for Leisure (FDLSX), Health (FSHCX), IT Services (FBSOX), Medical (FSMEX) and Insurance (FSPCX).
- An interesting factoid is that three very popular equities are held by up to eight different Sector Funds. Alphabet A (GOOGL) held by eight funds; Visa (V) held by six Funds; and MasterCard (MA) held by five Funds.
- The three largest dollar commitments collectively amongst all the Sector Funds are three different equities: Unitedhealth Group (UNH), AT&T (T); and United Parcel Service (UPS).
Already have the ChartPack? Here's how to upgrade:
- Log in to your account, then visit the "Manage ChartPacks" page (accessible from the bottom of the Members Dashboard or from the "Your Account" page).
- In the table that appears, find the entry for the "Tensile Trading ChartPack" (if you don't see the Tensile Trading ChartPack listed, that means that you haven't purchased it. Click Here to do so now).
- Click the "Re-Install" button next to the Tensile Trading ChartPack to start the update process
The download should take about 15 seconds, after which you can explore the new ChartLists and other updates!
New to the ChartPack? Here's how to install it:
If you'd like to add the Tensile Trading ChartPack to your StockCharts account, Click Here.
Trade well; trade with discipline!
- Gatis Roze, MBA, CMT
- Grayson Roze, Business Manager, StockCharts.com
StockMarketMastery.com
Co-Authors, Tensile Trading (Wiley, 2016)
Co-Presenters, How To Master Your Asset Allocation Profile


