
Free money! Get your free money here! All you have to do is be willing to get off the sofa and walk over to the corner of the house where you adjust your portfolio. It's literally that easy. That's how simple it was using the ChartPack in 2019. If you simply had the discipline to step through these ChartLists, the opportunities jumped out at you. When the pundits and talking heads were prognosticating a bear market for 2019, our bullish and bearish dashboard (ChartList #10.4) remained clearly bullish.
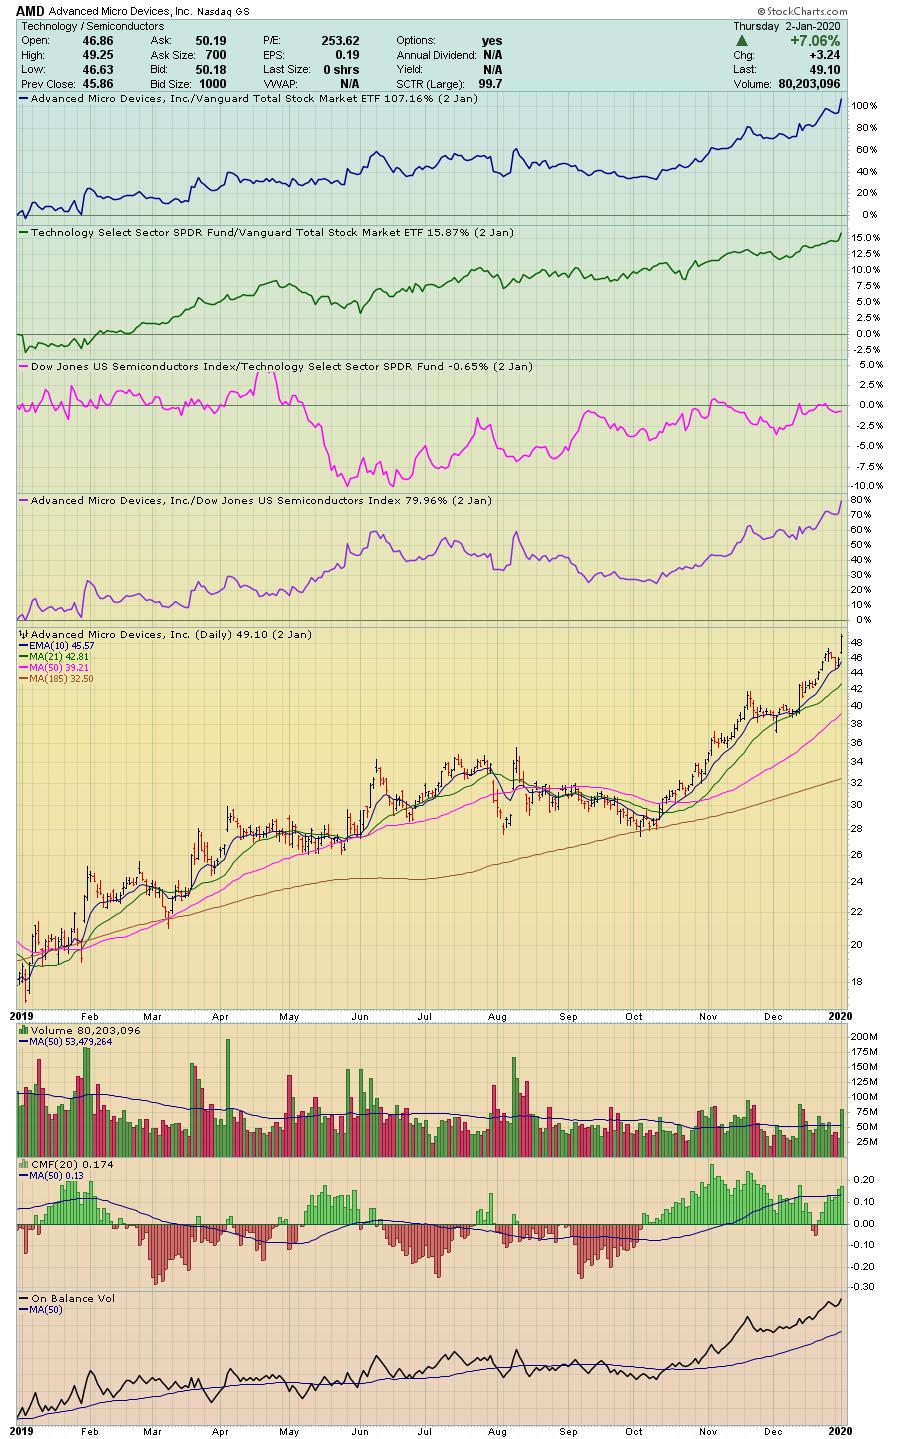
The Sector ChartLists guided us away from the pundits' bullish Energy Sector projections and clearly pointed us instead to the Technology Sector and specifically to the four Industry Groups of Semiconductors, Computer Hardware, Software and Electronic Equipment. They all outperformed the market by a wide margin.
Our indexes were up over 35% (NASDAQ) and stocks such as Advanced Micro Devices (AMD) — a stock in the strong tech sector and the semiconductor industry group — marched upwards of +150%. It's a great time to be an investor. Get off the sofa and join us.
Once again, many thanks to our ChartPack community for suggesting many of these enhancements. Here are some of the more significant updates for this quarter.
#10.2 – Permission to Buy Allocations
One of the most impactful decisions we investors must make is whether the present market is favoring growth or value equities. A member of our user community suggested that we include two new tickers to our 2.2 Growth versus Value Chart — justified by the objective that we always seek confirmation. Therefore, we now have two growth ETFs (IWO an d RPG) plotted in green, and two value ETFs (IWN and RPV) plotted in purple. Visually, this makes it abundantly clear whether the markets are favoring growth stocks or value stocks.
#10.4 — Bullish & Bearish Dashboard
This collection of 15 historically significant indicators never came close to flashing a sell signal in 2019. Despite the constant and unrelenting negative stories in the media — plus the pundits ominous pronouncements — our dashboard clearly told us another story for 2019. Our dashboard consistently announced that the bullish camp held the balance of power amongst our ChartList of indicators such as unemployment, earnings, breadth, momentum, etc, and it clearly kept us in the game.
The only negatives were these: (1) the yield curve nearly inverted but did not, (2) the trend for the Fed funds rate was indeed negative, (3) the industrial production index went sideways, and the (4) the S&P 500 earnings chart warranted close monitoring. As a result, the scoreboard was one bearish indicator, three neutral indicators, and eleven bullish indicators. The conclusion for 2019 therefore was to stay in the market.
Please note — 4.2 Momentum: Once again, with another great suggestion from our user community, we've enhanced the momentum chart by adding iShares MSCI USA Momentum Factor ETF (MTUM) to the chart. We also now plot its ratio (see black line) to the NYSE index, thereby making it easy to ascertain if momentum stocks are in favor and outperforming the NYSE index or not. Remember to always read the extensive descriptions below the graphs in the ChartNotes. Historically, momentum and divergencies have been leading indicators.
#100 — Indexes Master
This ChartList of nine graphs is your money banking machine. It needs to be part of every investors routine, regardless of which personal timeframe you invest. Here are my own three reasons and motivations:
- I need to know the trend of the market. These nine charts clearly tell me if we are in an uptrend, a sideways market or a downtrend. I also look for confirmations amongst the different indexes which can give me more confidence in the existing trend.
- It clearly shows me those areas of the market where I need to over-allocate versus other areas when I need to under-allocate assets. For example, in 2019 iShares EAFE Index (EFA) International Stocks (+21%) underperformed the NASDAQ Index QQQ (+41%) by a significant margin.
- This is extremely personal, but being a "mature trader", I want to work less and let the markets work harder on my behalf. What I mean is that I pay close attention to seasonality — first at this market index level and then also with individual equities. Let's use QQQ — the NASDAQ 100 Index — as an example. I'm much more focused and active in the winter and spring months. Why? Look at the performance chart for QQQ.
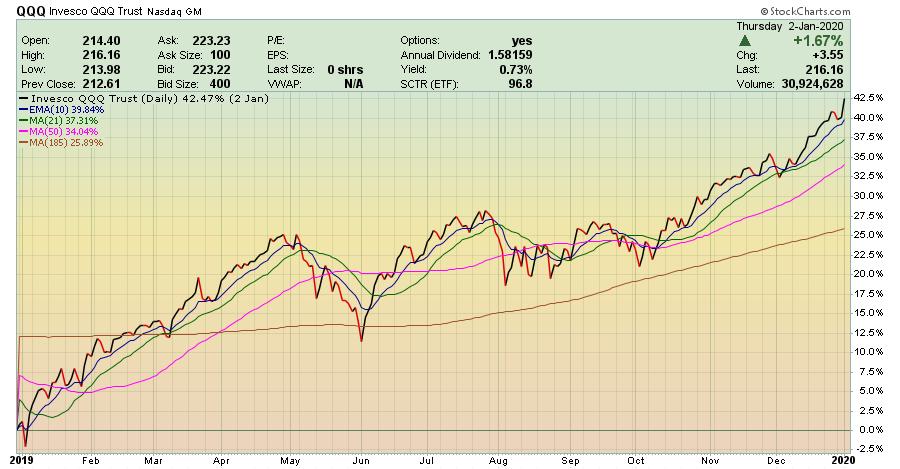
- January 2019 to April 2019 — up 25%
- Summer 2019 to Fall 2019 — sideways
- October 2019 to December 2019 — up 15%
Did I make my point? Use Seasonality to your advantage for stocks, ETFs and even mutual funds. At the bottom of every Sharp Chart there is a "Seasonality Chart" tab.
#205— Country Funds
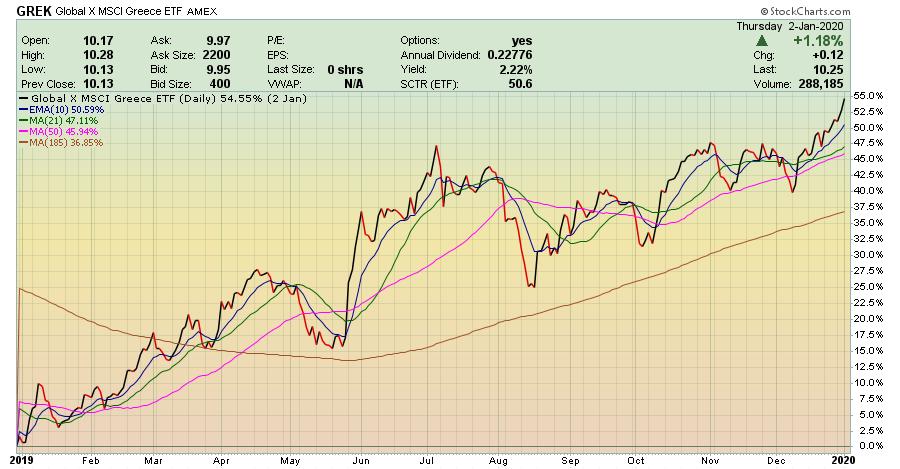
We've long maintained that allocating 1% to 5% of your portfolio amongst global country fund ETFs can be very very profitable and gives you more reason to read the Economist magazine. Aside from the financial benefits, this is sure to make you a much more interesting individual at cocktail parties! What more can I say. Once again, 2019 makes my case. Greece (GREK) was up +50% while Brazil Small Caps (BRF) and Russia (RSX) were both up over +40%.
This ChartList contains 55 country fund ETF charts. We've improved them by making all the headings more descriptive (using the Verbose tag) and by adding a moving average to the relative performance charts at the top of each country fund chart.
NEW LIST! #416 — Growth Stock Mutual Funds
With the immense success we've had over the years prospecting for high performance stocks each quarter amongst Fidelity Select Sector Funds, we've decided to apply the same principles to mining for growth stocks amongst the top five growth-stock oriented mutual funds. As we write this, all five funds are top rated by Morningstar (5-stars) and all have outperformed the market by wide margins. In an effort to be concise and not expand the number of ChartLists, look for the bottom line insights each quarter in the comments section below in the ChartList Notes.
The full portfolio analysis is in the ChartPack, but here are a few sample highlights:
- Amazon is held by all five of these top funds.
- Four funds all own Microsoft, Alphabet A, Facebook A, Mastercard, Salesforce and PayPal.
- The largest dollar commitments in percentage terms are in Amazon, Microsoft, Apple, Alphabet A and Facebook.
Note: These five mutual funds all outperformed the S&P 500 over the past ten years by tremendous margins. The range of outperformance is from +50% to over +100%. Clearly. to achieve these results they must over-weight their favorite stocks versus the standard S&P 500 allocation.
This is how we benefit as individual investors. By knowing both the specific stocks and the size of the commitments made by Wall Street's top stock pickers, we too can ride the coat-tails of their wisdom, research and success.
#420 — Fidelity Select Fund Charts
Ladies and Gentlemen: this two-step approach is a thing of beauty and profit generating if you are willing to make even the smallest of efforts. We've laid it all out for you to minimize your time and maximize your payouts.
Step 1:
ChartList 420 is populated with all 43 Fidelity Select Sector Funds. In this case, we'll assume we are intermediate-term investors and will sort this ChartList by performance over one year. Both Electronics / Semiconductors (FSELX) and Technology (FSPTX) consistently plotted higher highs throughout 2019. Up +67% and +53% respectively — and remember, these are diversified sector funds. One can stop here and simply buy these no-load funds.
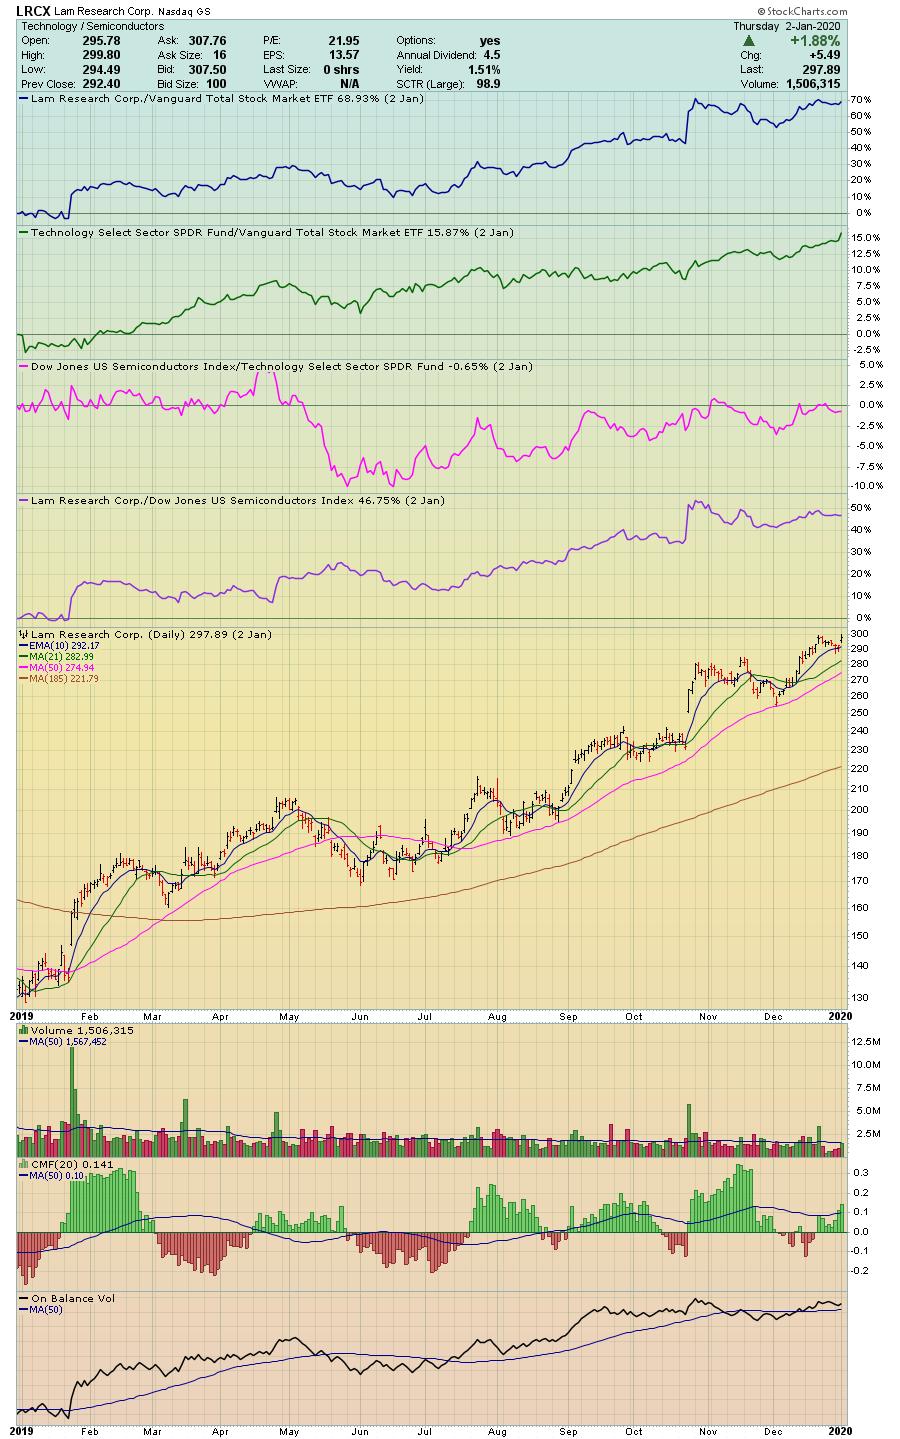
Step 2:
If you are seeking higher growth, then proceed to Step 2. To illustrate, ChartList 420-77 is populated with the top individual equities contained in the Fidelity Sector Semiconductors Fund (FSELX). Grayson and I update these holdings every three months in the ChartPack for your benefit as well as our own. Clearly, the Fidelity research juggernaut believes certain individual stocks have more potential. They are telling us to buy Lam Research (LRCX) up +125% in 2019, Nvidia (NVDA) up +80% and Micron (MU) up +70%. This is how we individual investors let the big institutions show us precisely how to make money — to that we say "thank you!"
Here are a few additional highlights from this quarter's Fidelity sweep:
- For the second quarter in a row, we noticed that the Air Transportation Portfolio (#420-12) was particularly active. After a busy Q3, the fund added two VERY large positions to its top 10 holdings, including a major airline that recently posted a healthy beat in its latest earnings report. Check out the 420-12 ChartList to take a look.
- One of the indicators that we watch closely is housing starts, which recently made a major jump higher as you can see on Chart #7 of my Shared "Weekly Evaluation" ChartList. With that in mind, it was interesting to note the moves made by the Construction / Housing portfolio (#420-28). That fund saw three new additions to its top 10 holdings, and some of the charts are really beginning to move higher.
- Two other funds that were particularly active – Financial Services (#420-44) and Materials (#420-62). Both are worth some investigation when you install the ChartPack's latest version.
- My favorite observation from this past quarter came from two different funds – Multimedia (#420-66) and Wireless (#420-90). Both of those funds added substantial positions in LYFT, one of the two major ride share companies. This is the first time that either of those two have been included in any of the Fidelity Select funds top 10 holdings, and that institutional support starting up could be a healthy boost here. For long-term investors thinking about a potential play on the ride share market, this could be an intriguing moment.
Already have the ChartPack? Here's how to upgrade:
- Log in to your account, then visit the "Manage ChartPacks" page (accessible from the bottom of the Members Dashboard or from the "Your Account" page).
- In the table that appears, find the entry for the "Tensile Trading ChartPack" (if you don't see the Tensile Trading ChartPack listed, that means that you haven't purchased it. Click Here to do so now).
- Click the "Re-Install" button next to the Tensile Trading ChartPack to start the update process
The download should take about 15 seconds, after which you can explore the new ChartLists and other updates!
New to the ChartPack? Here's how to install it:
If you'd like to add the Tensile Trading ChartPack to your StockCharts account, Click Here.
Trade well; trade with discipline!
- Gatis Roze, MBA, CMT
- Grayson Roze, VP of Operations, StockCharts.com
Co-Authors, Tensile Trading: The 10 Essential Stages of Stock Market Mastery (Wiley, 2016)
Co-Presenters, How To Master Your Asset Allocation Profile
Trade well; trade with discipline!
Gatis Roze, MBA, CMT
- Author, "Tensile Trading: The 10 Essential Stages of Stock Market Mastery" (Wiley, 2016)
- Developer of the "Stock Market Mastery" ChartPack for StockCharts members
- Presenter of the best-selling "Tensile Trading" DVD seminar
- Presenter of the "How to Master Your Asset Allocation Profile DVD" seminar
Chart on, my friends.
Grayson Roze
- Director of Operations, StockCharts.com
- Author, Trading For Dummies (Wiley, 2023)
- Author, Tensile Trading: The 10 Essential Stages of Stock Market Mastery (Wiley, 2016)
- Co-Founder, StockMarketMastery.com
- Twitter: @GraysonRoze