So I'm the lucky guy who gets to host "Your Daily Five" the day before election night. What a time to step in for a new show!
It's been a fascinating few weeks for markets, which of course is only fitting given all of the madness we've seen here in 2020 more broadly. As we fly towards Tuesday night, there's certainly no shortage of crucial charts to watch right now. I gotta say, I had a blast this morning sitting down to share five of my top selections.
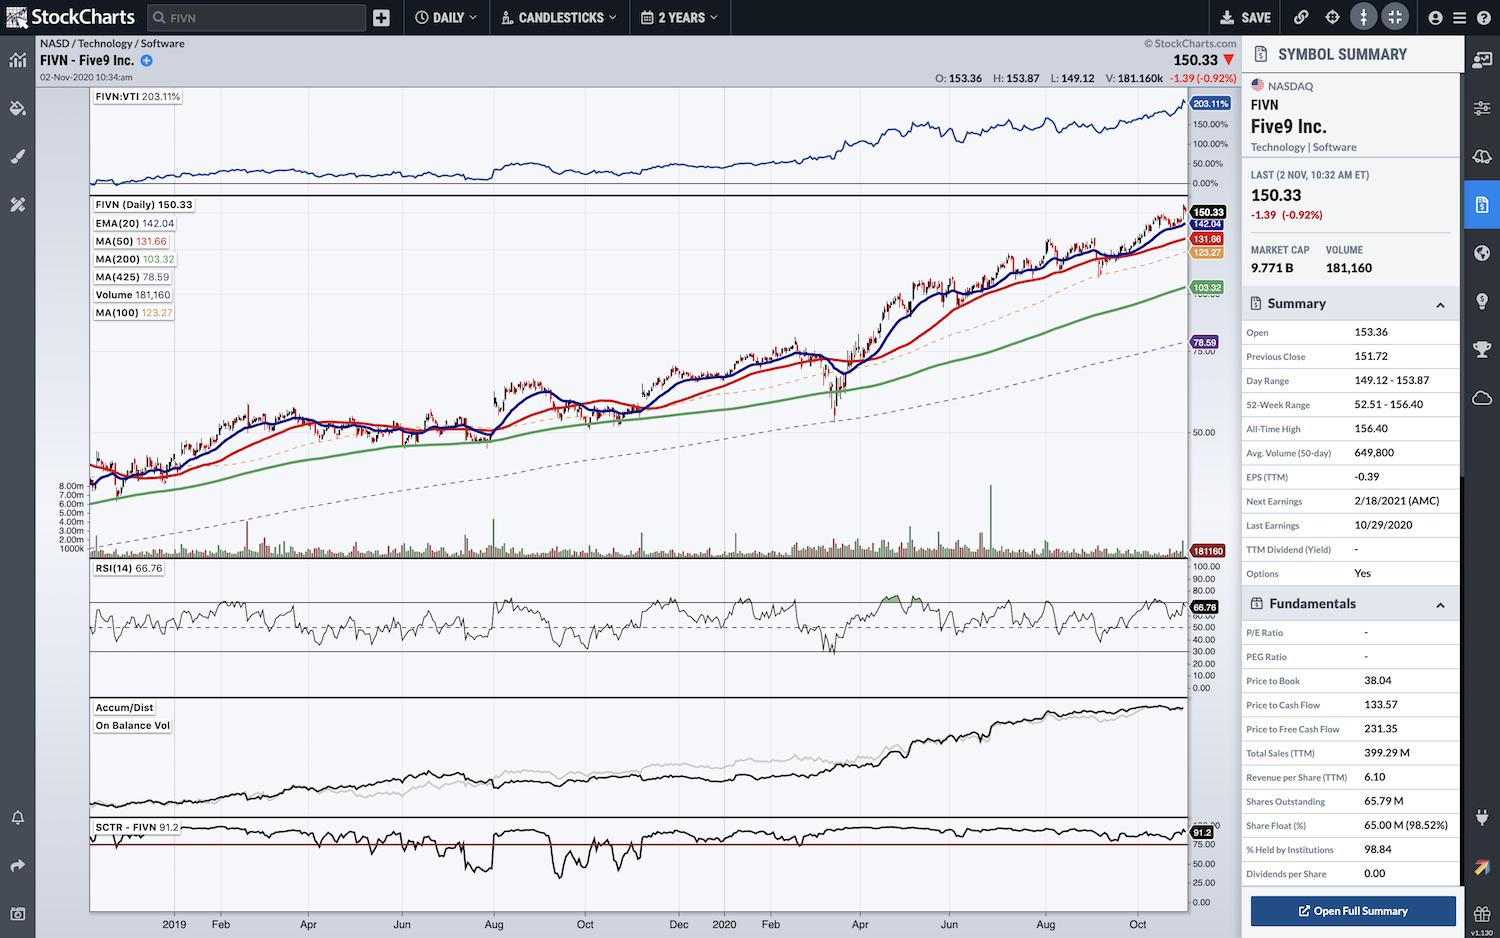
Even better, it was lots of fun to share all of these charts with you from StockChartsACP – our new full-screen, interactive Advanced Charting Platform. In particular, I highlighted a very cool new addition to the platform that just launched on Friday of last week. We've added a "Symbol Summary" view to the righthand side of the platform, which brings you tons of new data like after-hours prices, fundamentals, key technicals, earnings dates, corporate info and more. More on that in the video below!
Check out today's edition of "Your Daily Five" below:
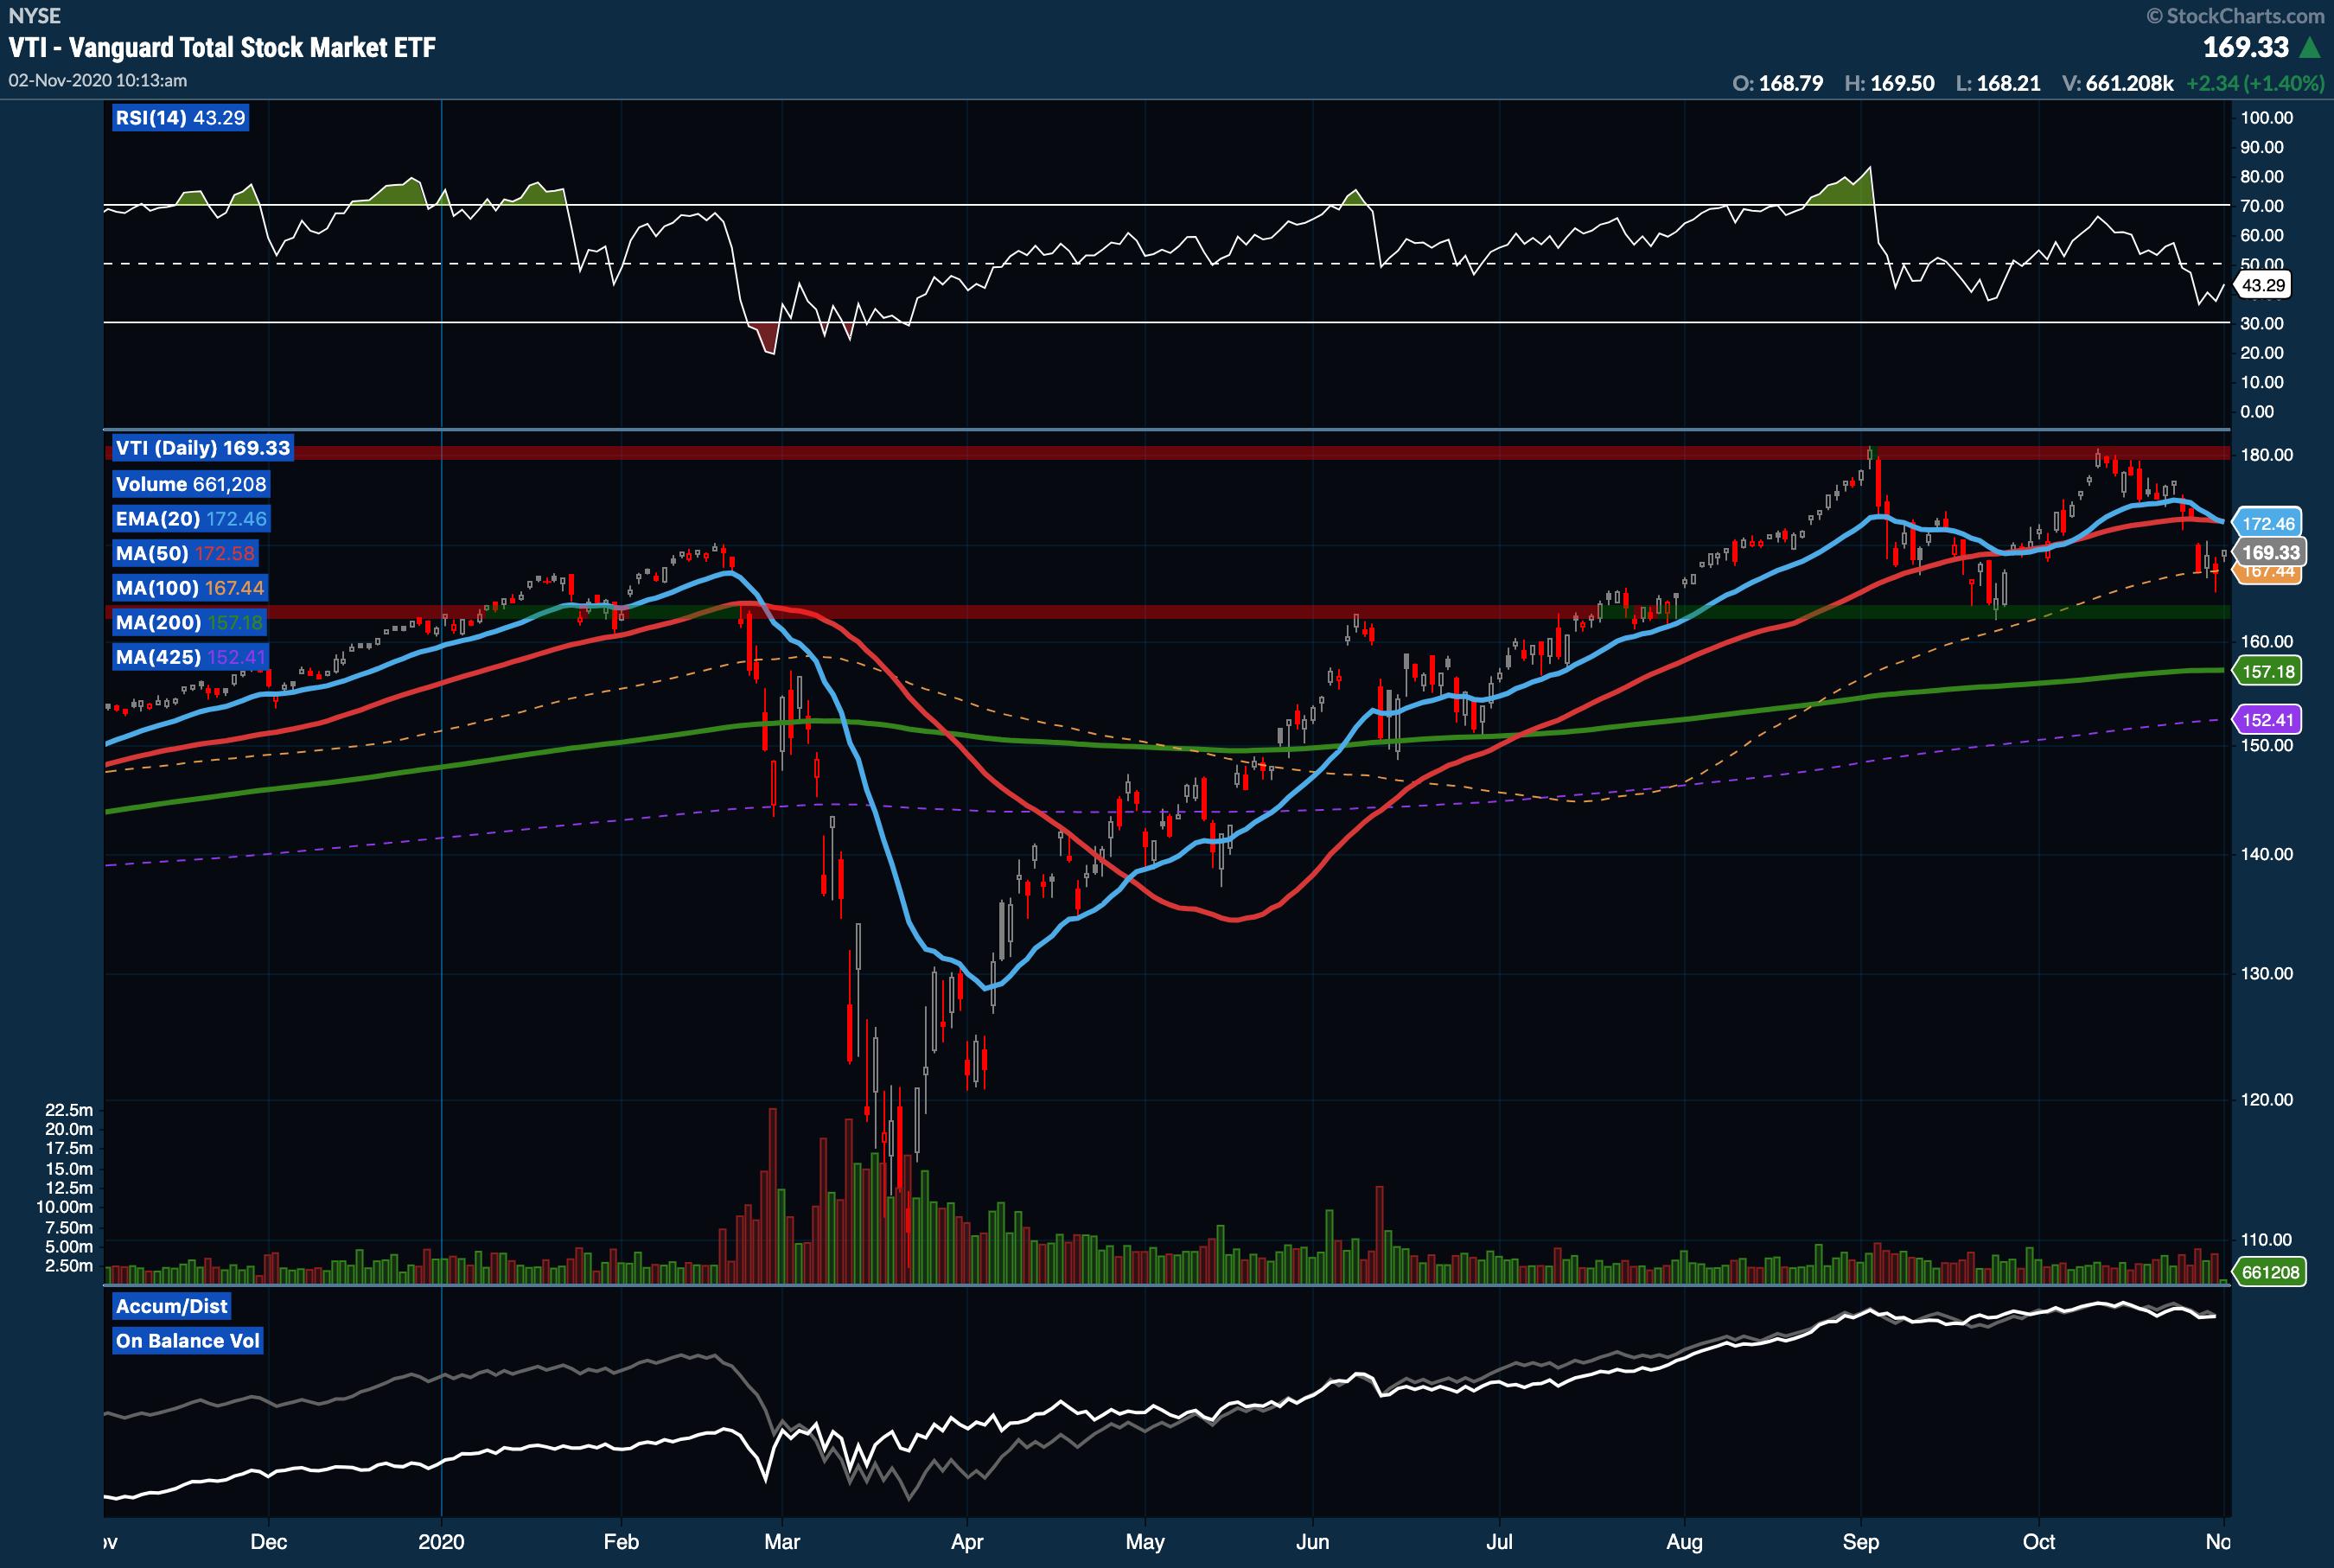
On this morning's edition, I started with a broad look at the total US stock market. One of the indexes I watch most closely is actually an ETF – the Vanguard Total Market index (VTI). While it is still a cap-weighted group that favors the largest stocks in the market, it does factor in smaller cap names in a way that a large-cap only index like the S&P 500 does not. As you can hear, I talked about some of the key levels I'm watching on VTI as the range bound sideways movement continues. However, I also noted last week's bounce off the 100-day Moving Average as an important bullish signal.
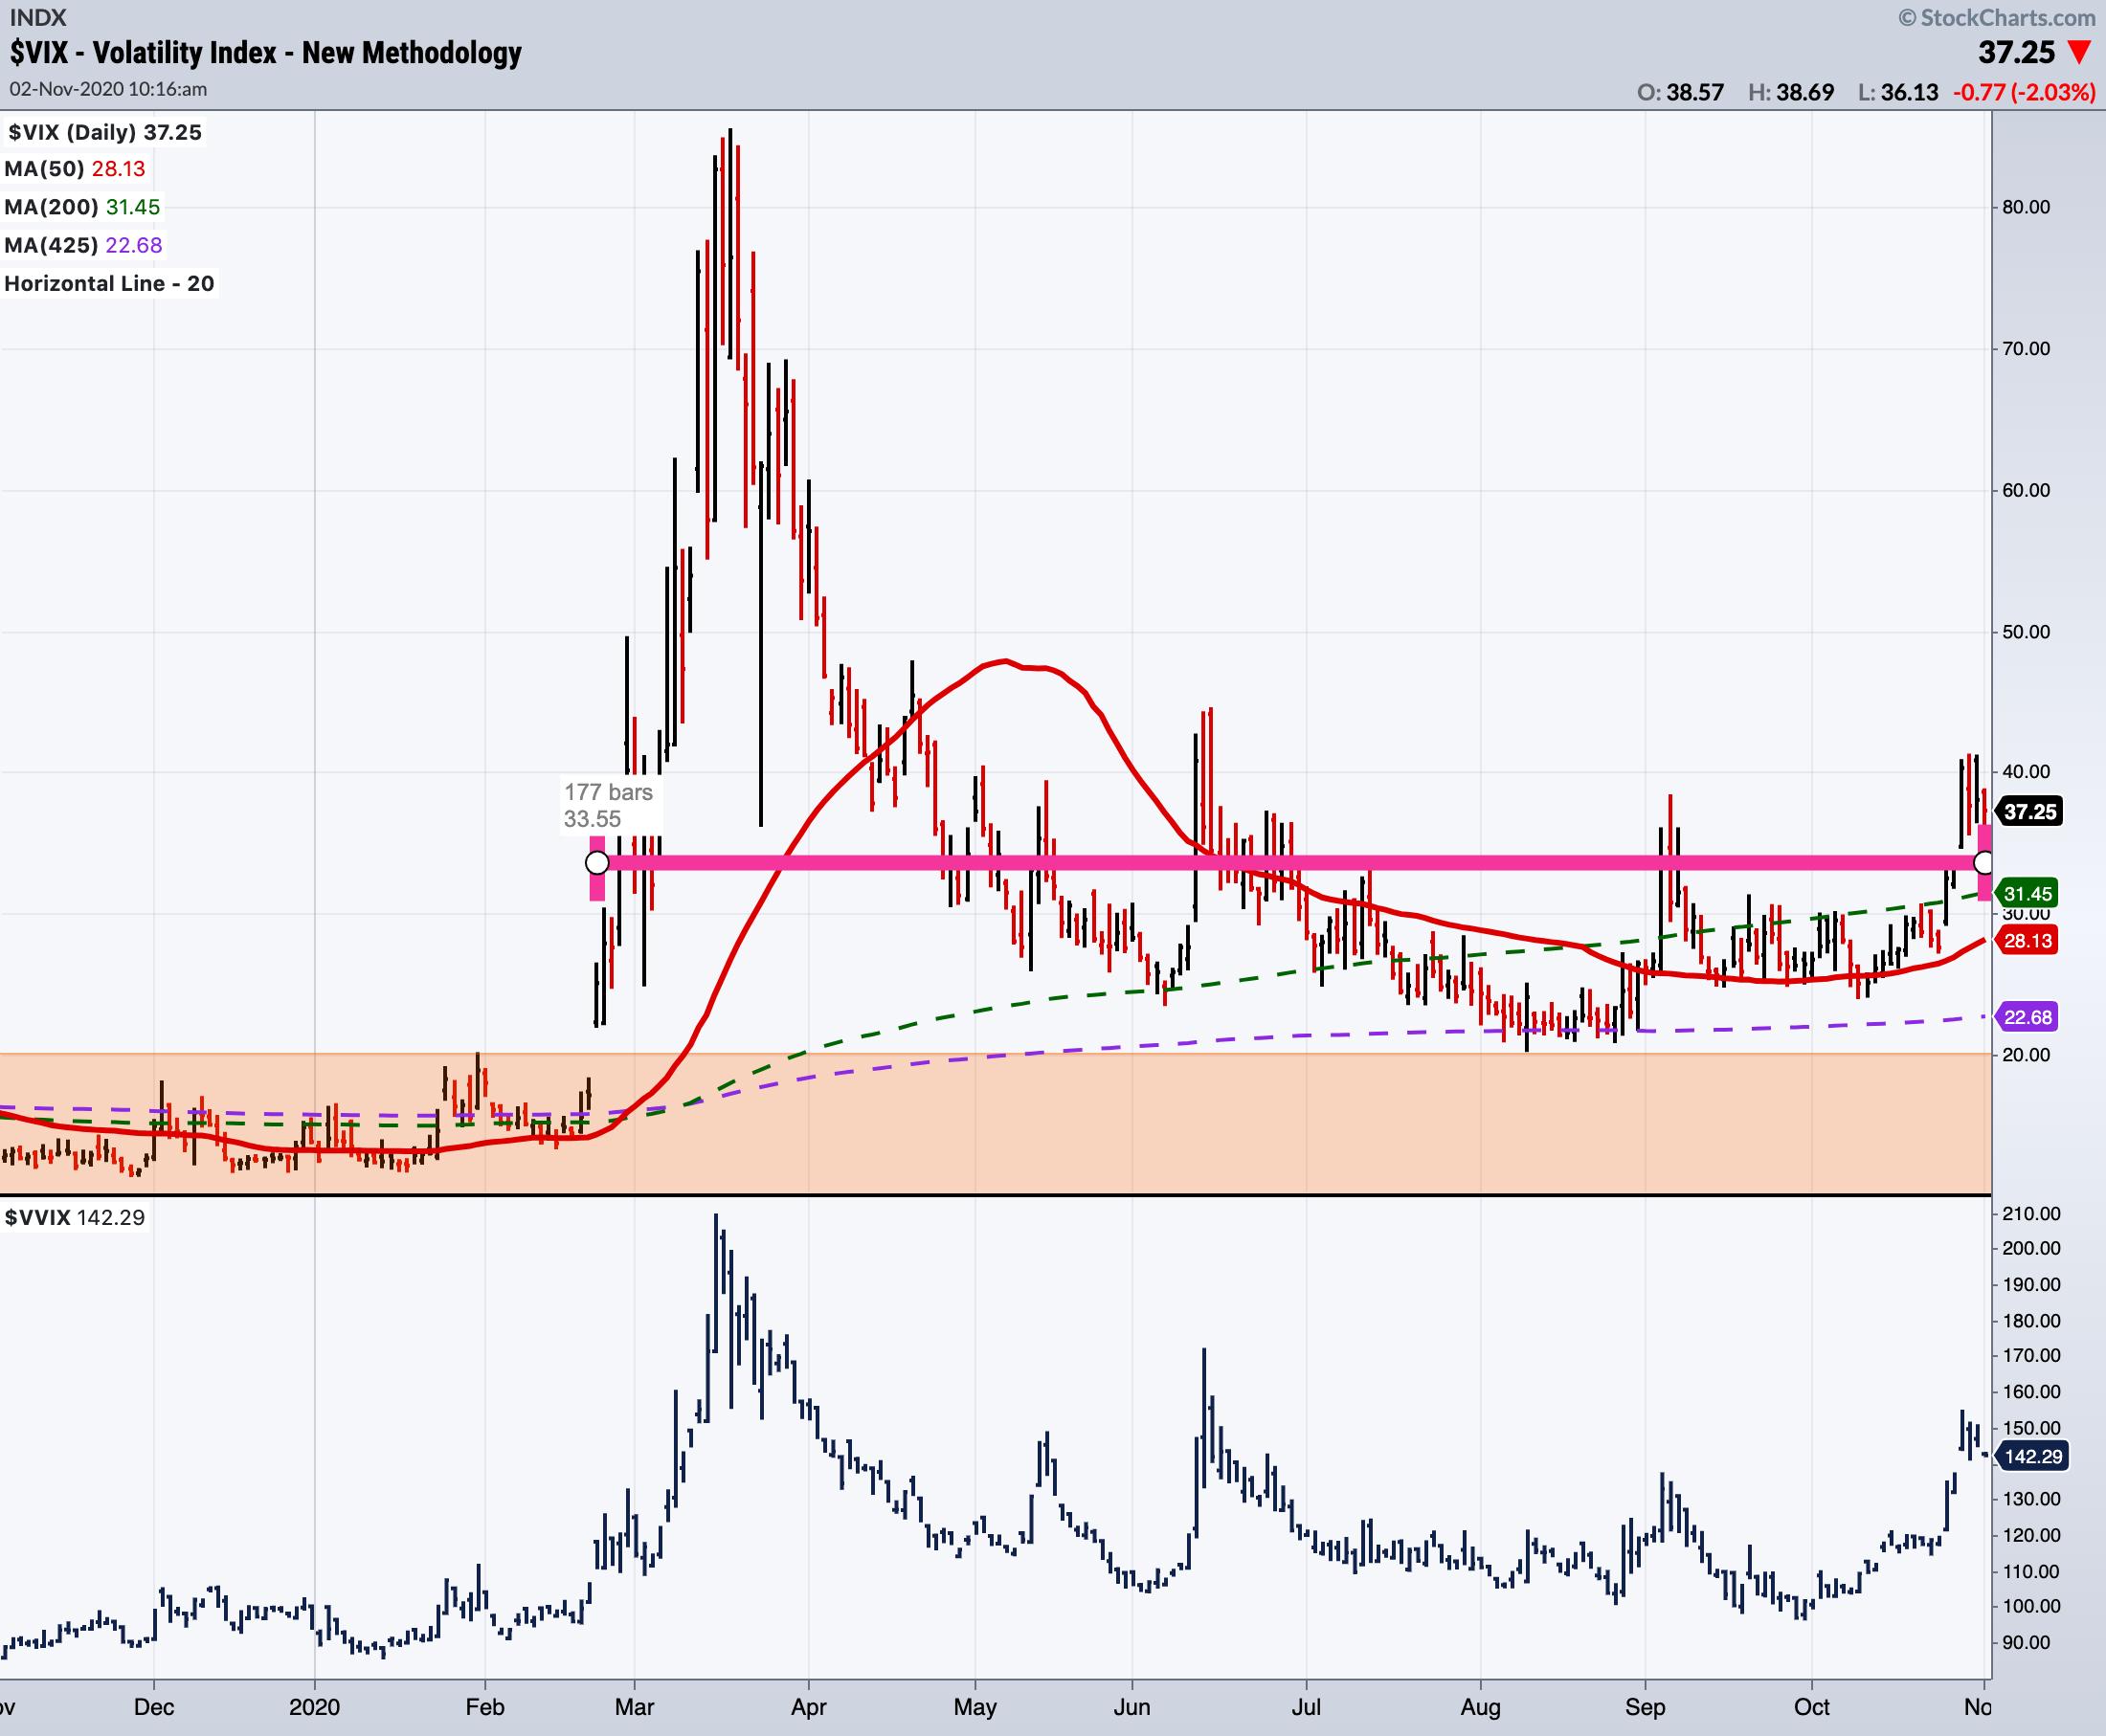
Next up, I took a look at the $VIX using the new "Auto Average" tool in StockChartsACP. As you can see from the pink line across the chart, the $VIX has remained highly elevated above 20 for the past 177 sessions, averaging 33.55 as of the time this chart was captured. It's a striking departure from what we've seen in the past few years, where the $VIX rarely found its way above that 20 level.
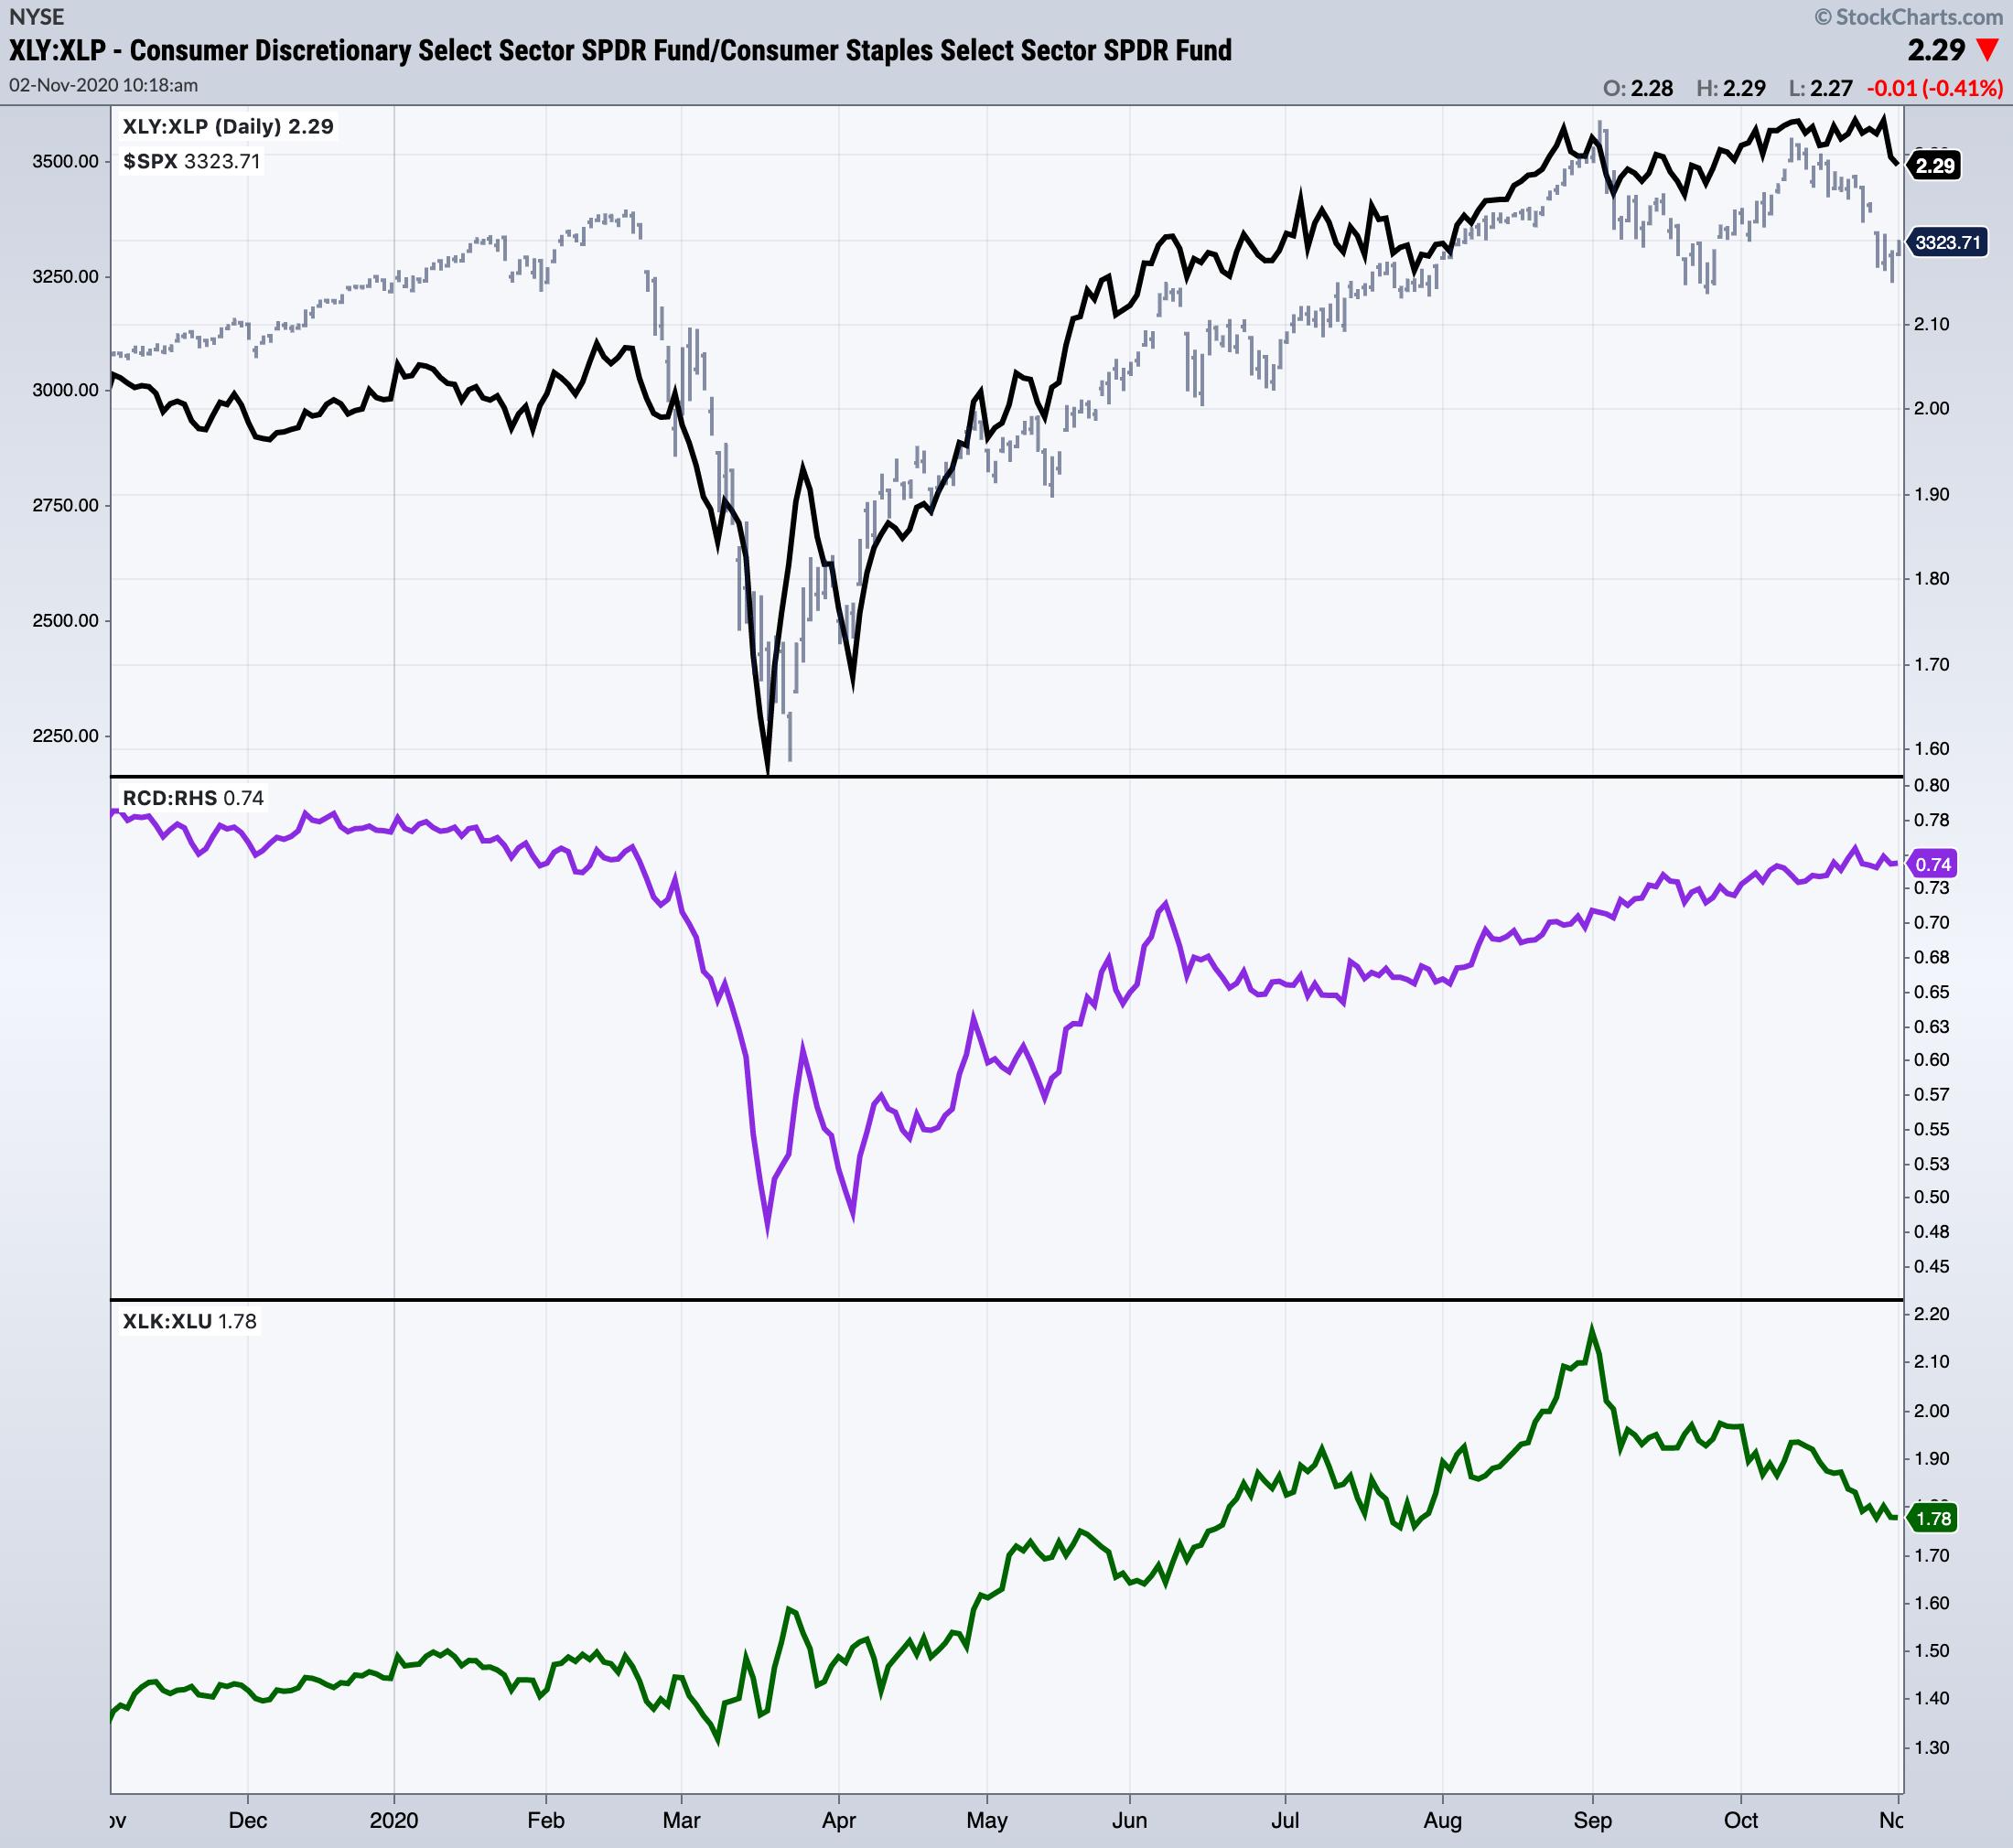
I also took a look at three charts I use to gauge whether the market is favoring "offense" or "defense". I pulled up two different flavors of the Consumer Discretionary vs. Consumer Staples ratio: the cap-weighted XLY:XLP and the equal-weighted RCD:RHS. Both show the market continuing to favor "offense" with these ratios moving higher overall. However, I also pulled up Technology vs. Utilities (XLK:XLU) in the panel at the bottom, which shows a substantial outperformance of Utilities over Tech. That goes firmly against the offensive leadership narrative, and it's definitely a point of concern for me at the moment.
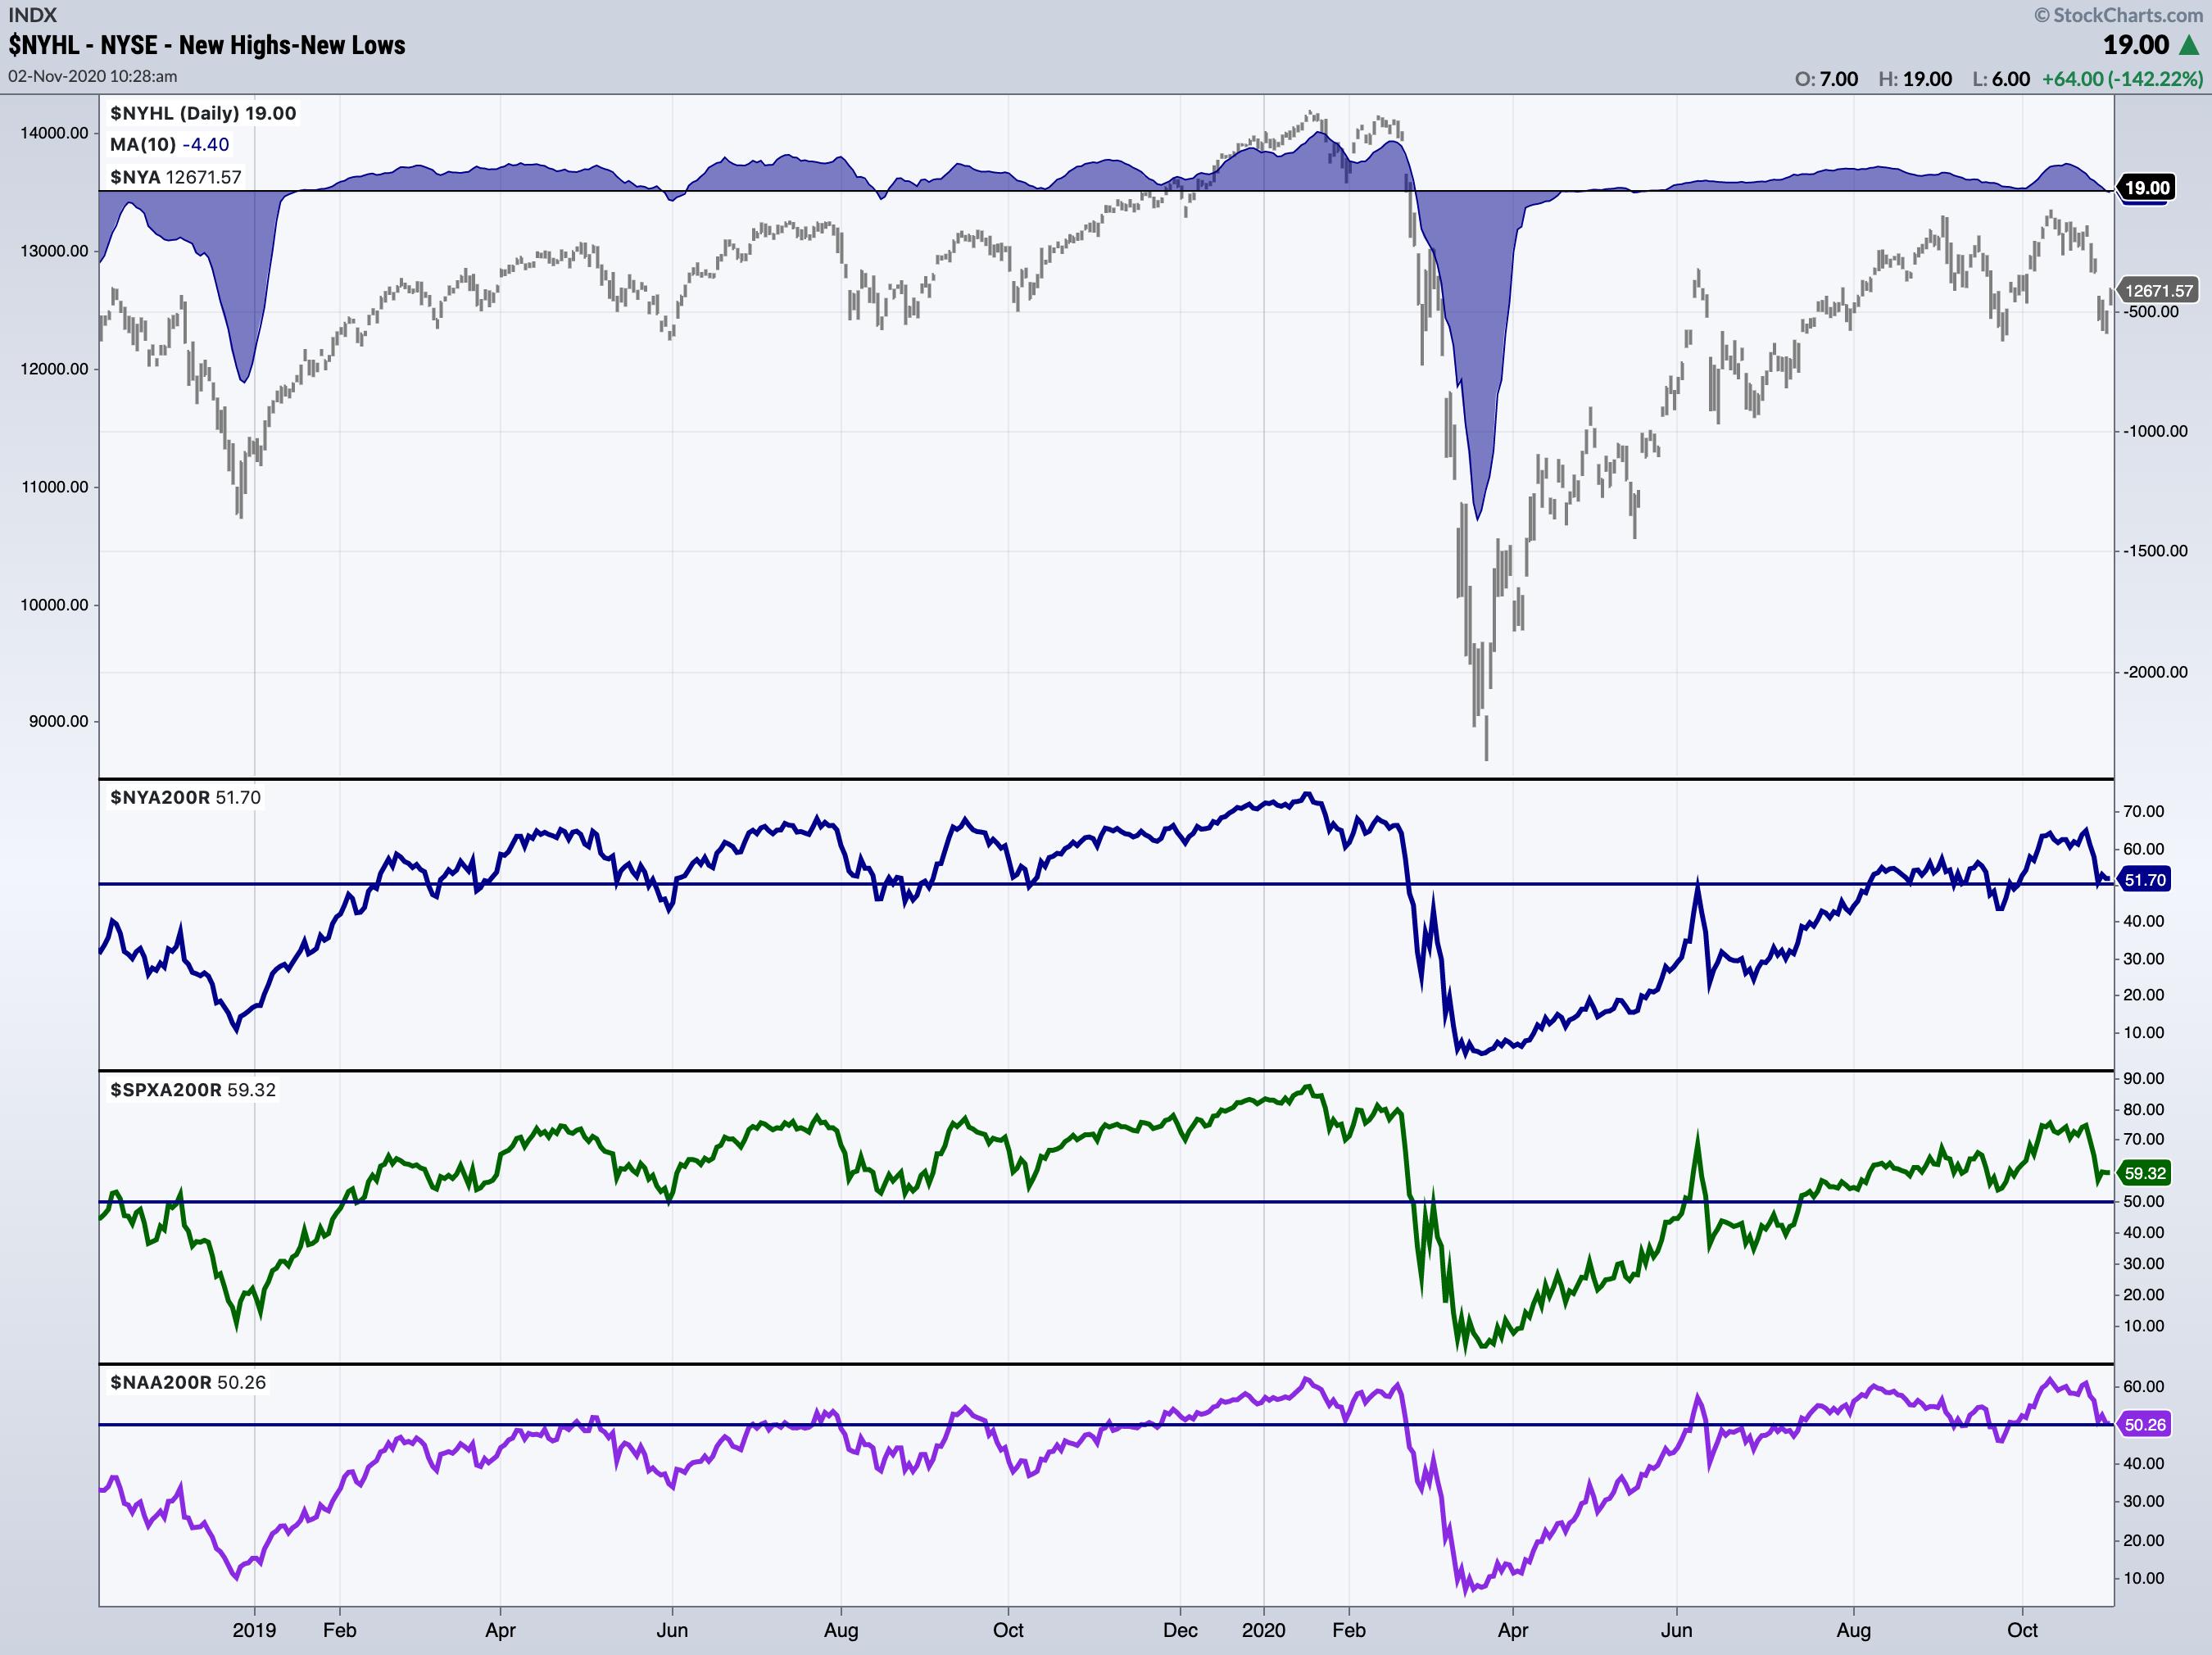
I wrapped up the show by sharing a look at some key breadth charts, which show a bit of deterioration but haven't quite reached levels that concern me too deeply. I also highlighted one stock that continues to show meaningful strength and tremendous outperformance: Five9 (FIVN).
Money In, Eyes Open.
- Grayson Roze
VP of Operations, StockCharts.com
Author, Trading For Dummies (Wiley, 2017)
Author, Tensile Trading: The 10 Essential Stages of Stock Market Mastery (Wiley, 2016)
Chart on, my friends.
Grayson Roze
- Director of Operations, StockCharts.com
- Author, Trading For Dummies (Wiley, 2023)
- Author, Tensile Trading: The 10 Essential Stages of Stock Market Mastery (Wiley, 2016)
- Co-Founder, StockMarketMastery.com
- Twitter: @GraysonRoze