 Welcome to a virtual SWAT team of elite charts and essential organized routines. This Stock Market Mastery ChartPack is now 15 years in existence. Eight years ago we made it available to the public but prior to that, I used it in my college investment courses. The point being, that after all these years of quarterly updates, it has actually been built by a user community that numbers in the thousands.
Here's why this ecosystem of ChartLists should become your personal dashboard to navigating the stock markets. It focuses your routines on the key indicators and helps you ignore the frivolous distractions. Better analysis and higher probability trades in less time.
#105: Master ETFs Watch List
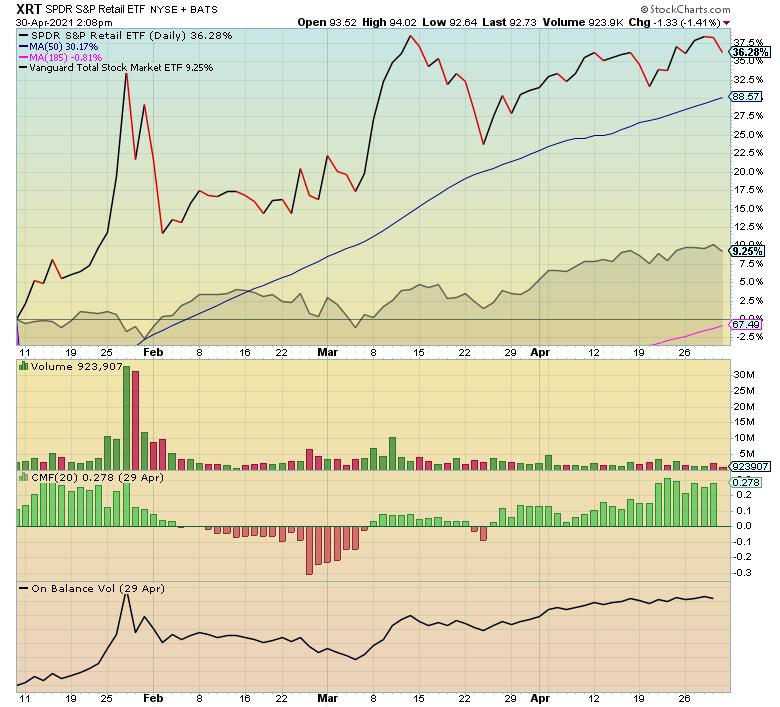
It's been six years since a prominent research firm began rating ETFs. In a universe of thousands, they assigned their top rating to only 42 ETFs. This ChartList highlights those top rated equities, and it includes another 150 Core ETFs based on their trading volume.
With this ChartList, it's easy to see where the money is flowing. Sorted by year-to-date (YTD) performance, 20 ETFs have more than doubled the S&P 500's results. It's obvious where the large institutions are moving money, and it's just as obvious where they are not. As always, we've pruned the lowest volume ETFs. If they aren't trading at least 50,000 to 100,000 shares a day, investors should look elsewhere as a rule.
#300: Market Breadth
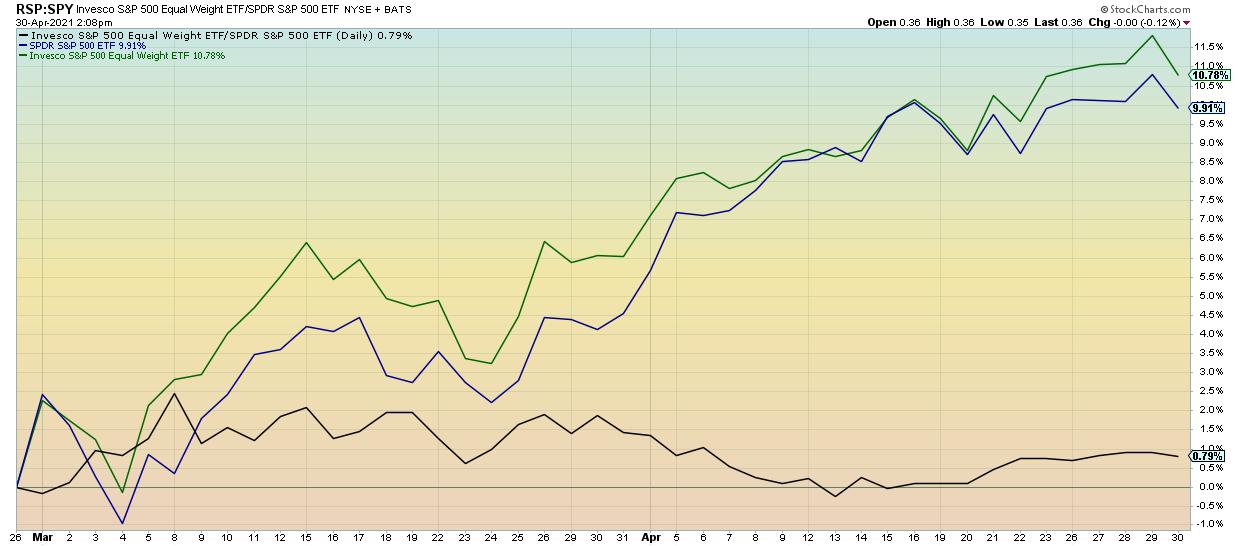
Don't overlook these 11 charts and the insightful commentary beneath each chart which has been contributed by our ChartPack community of users in many cases. Breadth is so much more than simply new highs and new lows. The unique visual presentations highlight confirmations and divergences, include momentum indicators and reveal the different behaviors of NYSE stocks versus NASDAQ stocks.
Presently of interest, note how RSP (equal-weighted S&P 500) is outperforming the top heavy cap-weighted SPY. Be sure to read the notes below the charts. Historically, wider participation has been a good omen for the markets, and this chart clearly shows this.
#450: US Dow Industries
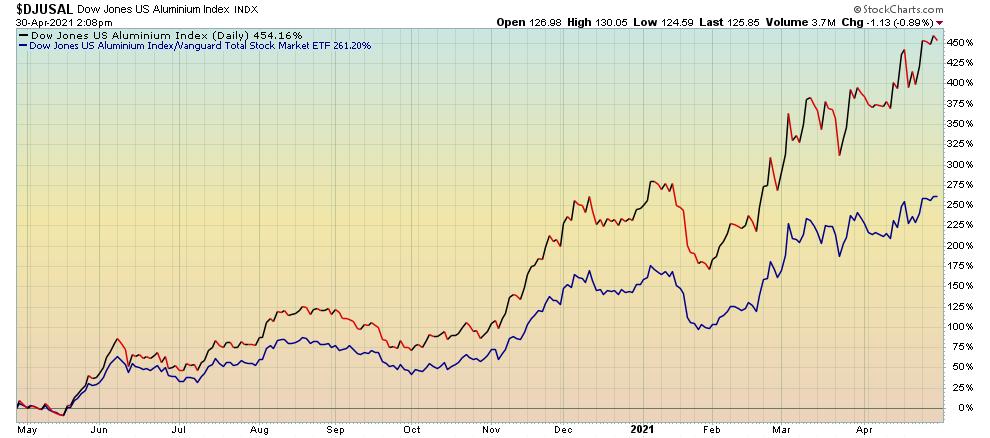
In the USA, commerce is divided into 152 industry groupings by Dow Jones. There is an important reality to embrace about the stock market — much as in nature. The Law of Groupings applies. In other words, you are the company you keep so chose your company carefully.
Year-to-date, the Vanguard Total Market ETF (VTI) has achieved over 12% appreciation. In the same period, six of these industry groups (such as furnishings and tires) have tripled those returns with aluminum being nearly five-times that benchmark. Similarly, on the flip side of the equation, six industry groups have barely achieved half the performance of VTI. Back to my original comment. This ChartList points out which group you want to party with and which parties you should avoid. Powerful stuff.
#640: Dividend Darlings
Understandably, there has been a great deal of interest in the equities in this ChartList.
As the name implies, the focus here is on dividends. On a year-to-date basis, many stocks, ETFs and mutual funds in this ChartList have all outperformed the Vanguard Total Market ETF (VTI). Here you'll see the nine dividend-oriented ETFs which have outperformed, as well as 12 stocks that not only outperformed but paid dividends, too. For example, year-to-date, DVY — a dividend-oriented ETF — is up 23% versus VTI at only 12%. Stocks such as Home Depot, Chevron, Archer Daniels and Microsoft have all outperformed VTI and paid handsome dividends.
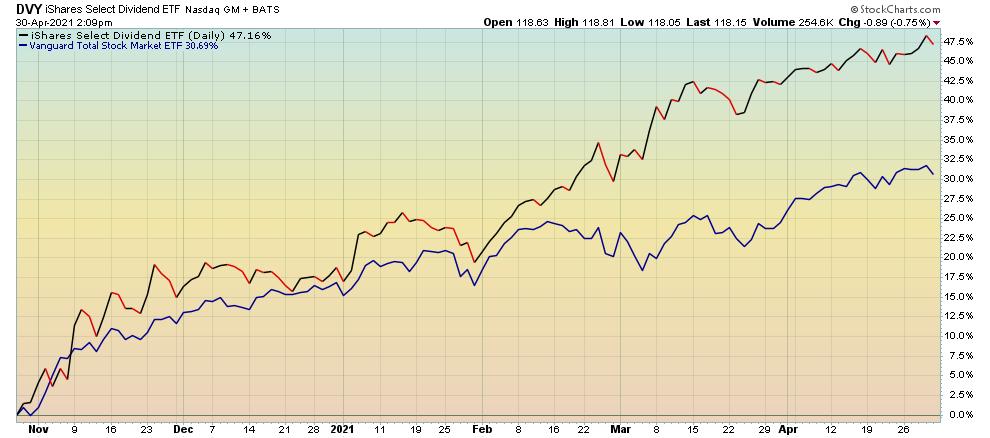
This quarter, we added five top performing ETFs, such as PEY and RDVY. If dividends are of interest to you, dig into this ChartList. There are stocks such as Proctor & Gamble (PG) and 3M which have raised their dividends for over 60 consecutive years. The quintessential examples of blue chip stocks. There are also high tech stocks, such as Cisco which yields 2.8% and Qualcomm which yields 2.0%.
All these dividend oriented groups are represented here:
- Dividend Growth
- Dividend Income
- Dividend Growth & Income
#416: Stock Pickers
This ChartList is the home of six mutual funds with managers who have outperformed the market (VTI) over the past three years, five years and ten years. That's consistency! We run an X-Ray of their holdings each quarter and update the ChartList notes section with our findings. Some fresh insights for you:
- Only one fund owns Zoom (ZM)
- In early 2020, DexCom (DXCM) was once very popular amongst these managers but its dollar percentage has been cut in half
- 93% of the holdings are North American equities
- Square (SQ) is now one of the top 8 holdings in dollars amongst these six stock pickers
- These managers have over-allocated to the Communication Services Sector by 100% compared to the S&P 500.
There are always new names that show up. Stellar stock pickers generally don't lose their touch overnight. For this reason, this ChartList is worth a regular visit. As always, read the ChartList notes below each one.
#420-12 to 420-90: Fidelity Sector Funds
Of course, we did our quarterly sweep of the Fidelity Select Portfolios, tracking changes to the top 10 holdings of each fund to see what these highly-capitalized and highly research-driven funds are up to. Following what the "smart money" is buying (or selling!) can yield powerful results when you're able to ride some of the big accumulation campaigns by fund giants like these. When a stock you own has institutional support at the highest level, it can be a very strong tailwind for your position. So, here are a few things we noticed:
- The Biotechnology portfolio (GR-420-18) was particularly active, and picked up a big new position in one of the primary COVID-19 vaccine providers. Biotech has been a volatile sector in recent months, so we looked closely at how the managers in this fund have been shifting their exposures within their top holdings.
- Another highly active fund this past quarter was the Industrials portfolio (GR-420-54). Five of the fund's top 10 holdings changed, which is quite a substantial shift and one that we don't see too often. Among others, two significant additions of note were General Electric (GE) and Boeing (BA).
- By far the most active portfolio this past quarter was the Natural Resources fund (GR-420-70). The top 5 largest holdings by the team are all new, as well as two others in the top 10 list. Spend a little bit of time with this ChartList to see all that's changed, both what's new for the fund's top 10 and what's fallen out.
- We also looked closely at the Wireless portfolio (GR-420-90), which took a substantial position in Facebook (FB), plus big positions in a 223 billion dollar Telecom stock and, curiously, a big position in one of the major ride sharing companies.
BONUS – The ChartPack Is Now ACP Ready!
 As you've surely heard, StockCharts has recently launched a new interactive, full-screen Advanced Charting Platform - StockChartsACP. This powerful all-in-one charting and analysis package brings you true dynamic charting with the ability to scroll back and forth through time, drag indicators and overlays up, down and around your charts, manipulate the y-axis with your cursor and much more. In short, the future of Technical Analysis and the next generation of StockCharts technology.
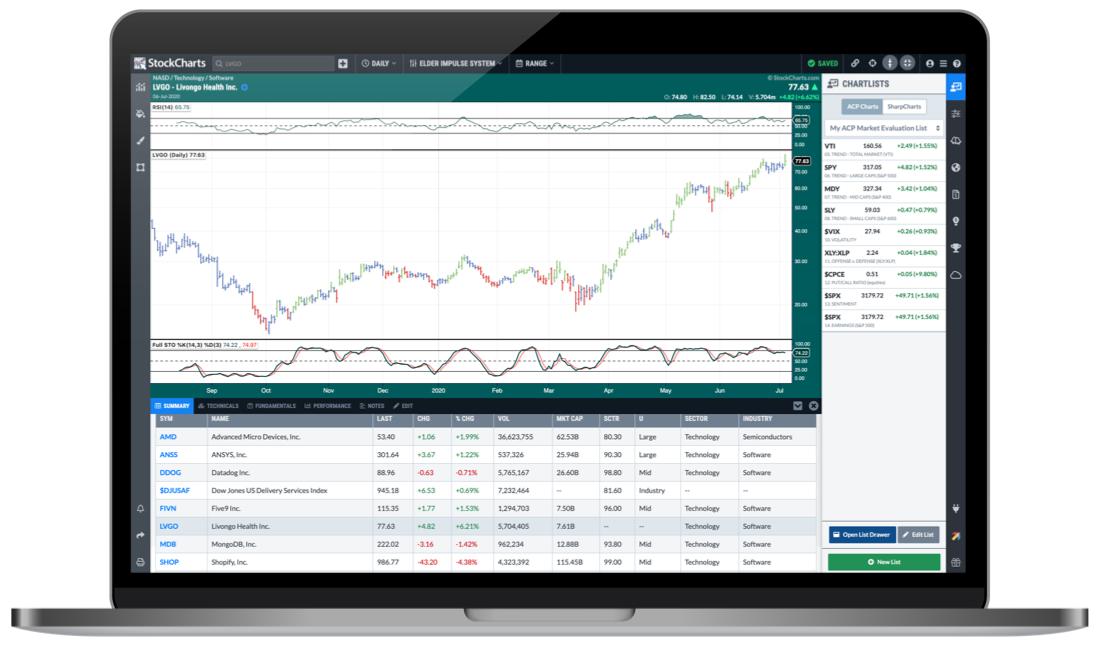
Now, one important feature of the new platform is the ability to view ACP versions of your existing saved SharpCharts. You can open the ChartLists sidebar (on the right) and click the "SharpCharts" tab to see your current ChartLists. You can then click on each symbol in the list to see an ACP chart that will very closely match the saved SharpChart. It's a great way to explore the new world of ACP, or quickly get set up with some of your favorite indicators and other chart settings.
What this means for all you ChartPack users is that you can easily explore the ChartPack in ACP, right out of the box. When you install the latest version of our ChartPack, all of the ChartLists and associated SharpCharts will be installed into your StockCharts account. You'll then be able to head over to ACP and browse through dynamic versions of all the charts included in the ChartPack.
Already have the ChartPack? Here's how to upgrade:
- Log in to your account, then visit the "Manage ChartPacks" page (accessible from the bottom of the Members Dashboard or from the "Your Account" page).
- In the table that appears, find the entry for the "Tensile Trading ChartPack" (if you don't see the Tensile Trading ChartPack listed, that means that you haven't purchased it. Click Here to do so now).
- Click the "Re-Install" button next to the Tensile Trading ChartPack to start the update process
The download should take about 10 seconds, after which you can explore the new ChartLists and other updates!
New to the ChartPack? Here's how to install it:
If you'd like to add the Tensile Trading ChartPack to your StockCharts account, Click Here.
Trade well; trade with discipline!
- Gatis Roze, MBA, CMT
- Grayson Roze, VP of Operations, StockCharts.com
Co-Authors, Tensile Trading: The 10 Essential Stages of Stock Market Mastery (Wiley, 2016)
Co-Presenters, How To Master Your Asset Allocation Profile
Trade well; trade with discipline!
Gatis Roze, MBA, CMT
- Author, "Tensile Trading: The 10 Essential Stages of Stock Market Mastery" (Wiley, 2016)
- Developer of the "Stock Market Mastery" ChartPack for StockCharts members
- Presenter of the best-selling "Tensile Trading" DVD seminar
- Presenter of the "How to Master Your Asset Allocation Profile DVD" seminar
Chart on, my friends.
Grayson Roze
- Director of Operations, StockCharts.com
- Author, Trading For Dummies (Wiley, 2023)
- Author, Tensile Trading: The 10 Essential Stages of Stock Market Mastery (Wiley, 2016)
- Co-Founder, StockMarketMastery.com
- Twitter: @GraysonRoze