
The final chart that I shared in my portion of the StockCharts 2020 Market Outlook (coming soon to our YouTube channel!) was a two-year chart of gold. After a pullback in the fall to Fibonacci support, gold appeared to be resuming its long-term uptrend. Later, gold reached an extreme overbought condition, which suggested a brief pullback before a resumption of the uptrend. That pullback has now happened. But is the uptrend now set to resume?
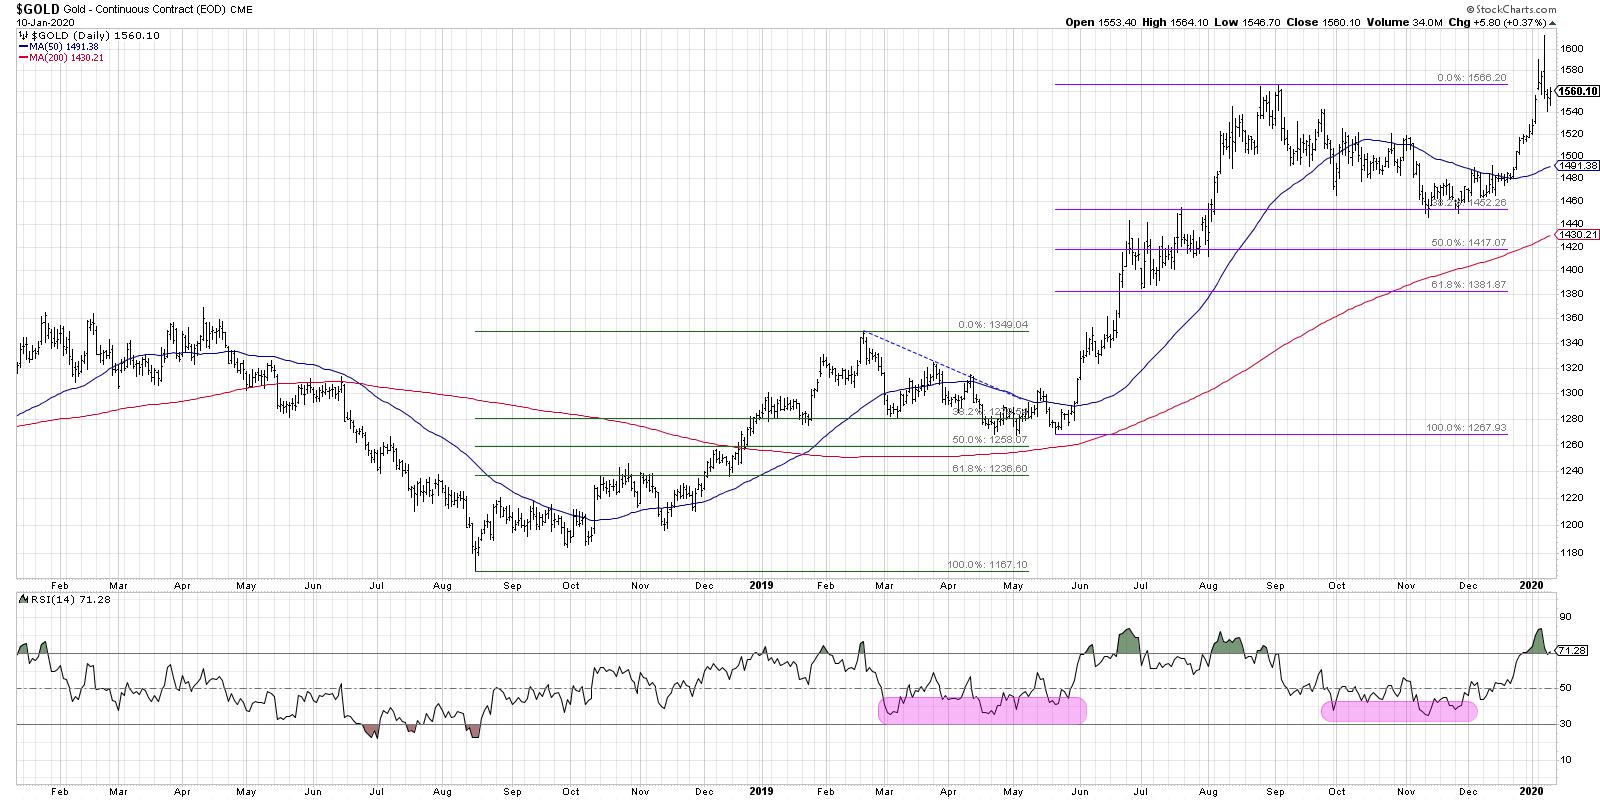
In February 2019, gold reached a short-term peak just below the 1350 level before pulling back to just below the 38.2% Fibonacci level. During this corrective period, the RSI on gold never really went below the 40 level, which often serves as support during bull phases.
After a three-month pullback period, gold resumed its uptrend and broke back above 1350 in June 2019. Soon after, the price rally pushed the RSI to the extreme overbought level above 80.
As I've discussed previously, this usually suggests a short-term pullback before a resumption of the uptrend. To put another way, the upside momentum is so strong that there is usually further upside in store.
Gold again reached an RSI above 80 in early August, but the final price rally in September saw a lower peak in RSI. This resulted in a bearish divergence, with higher highs in price but lower peaks in RSI (suggesting potential downside risk). From that point on, the chart of gold has appeared to repeat this pattern. The selloff last fall saw the RSI reach down to the key 40 level but not much lower. The price also found support at the 38.2% Fibonacci level, similar to mid-2019.
Heading into the new year, gold pushed back toward its previous high around 1566, while RSI has once again became extremely overbought. Akin to what we saw in the previous example, this would suggest a short-term pullback before further upside. The question now is whether it continues to follow the 2019 playbook and resume a long-term uptrend, or if it flounders back in the 1450-1570 range while equities continue their relentless climb to higher highs.
My guess is that the uptrend continues. But shouldn't gold suffer in a bullish equity environment? Not necessarily. While people love to think of gold as a safe haven, there are plenty of times where gold and stocks are positively correlated. The reasons as to why these trends evolve is often quite clear in the rearview mirror. For now, I'm happy following trends, following history and following sentiment!
In my recent interview with Ralph Acampora, he reminded me that the market doesn't always repeat, but it often rhymes. In this case, a review of gold prices in 2019 may be a good roadmap for gold prices in the first quarter of 2020.
RR#6,
Dave
David Keller, CMT
Chief Market Strategist
StockCharts.com
David Keller, CMT is Chief Market Strategist at StockCharts.com, where he helps investors minimize behavioral biases through technical analysis. He is also President and Chief Strategist at Sierra Alpha Research LLC, a boutique investment research firm focused on managing risk through market awareness. He is a Past President of the Chartered Market Technician (CMT) Association and most recently served as a Subject Matter Expert for Behavioral Finance. David was formerly a Managing Director of Research at Fidelity Investments in Boston as well as a technical analysis specialist for Bloomberg in New York. You can follow his thinking at MarketMisbehavior.com, where he explores the relationship between behavioral psychology and the financial markets.
Disclaimer: This blog is for educational purposes only and should not be construed as financial advice. The ideas and strategies should never be used without first assessing your own personal and financial situation, or without consulting a financial professional.
The author does not have a position in mentioned securities at the time of publication. Any opinions expressed herein are solely those of the author, and do not in any way represent the views or opinions of any other person or entity.


