Every Monday on StockCharts TV's The Final Bar, we look at the markets from three perspectives: top-down macro, sector rotation and bottom-up stock selection. In this week's review, we identified three sector charts that are potentially turning bearish and suggest broader weakness in the equity space.
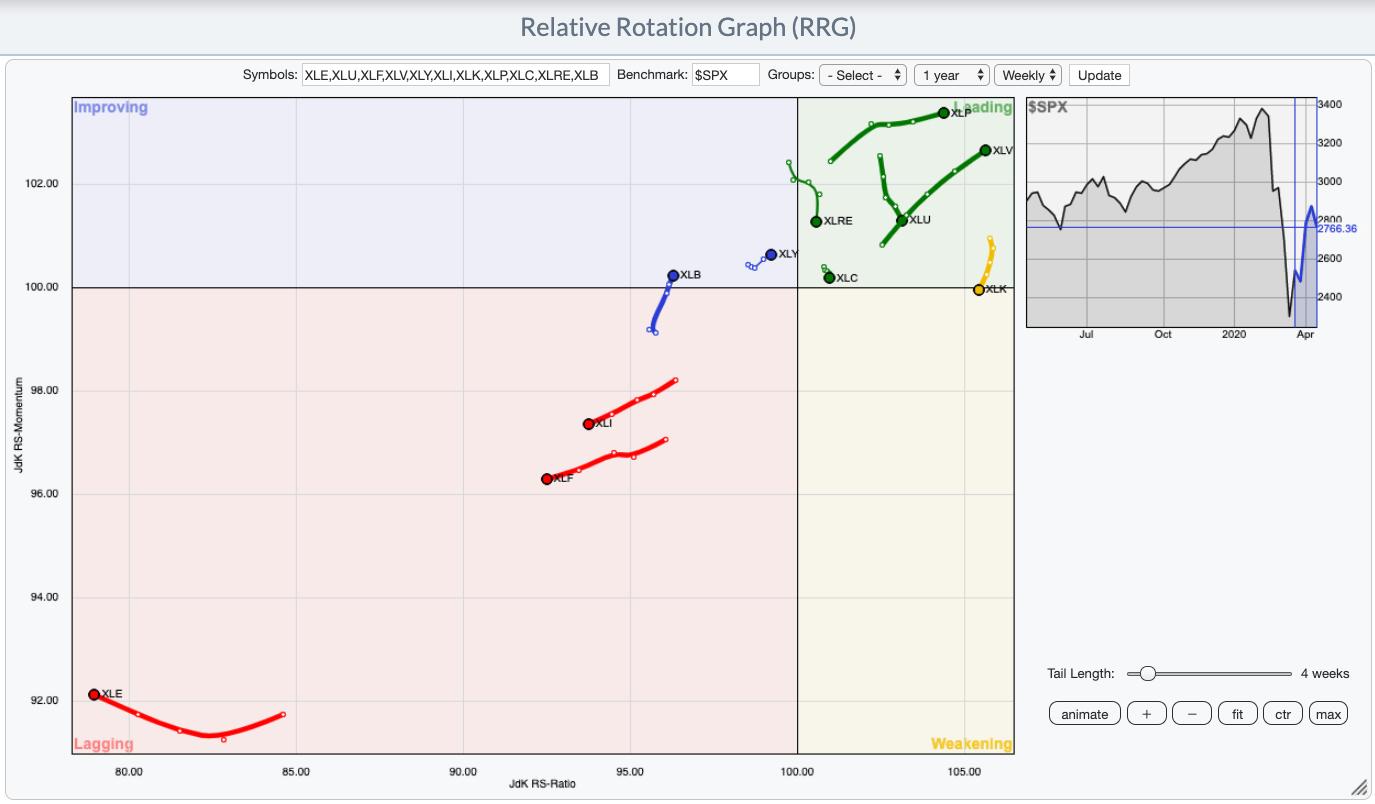
First, the Technology sector is rotating from the Leading quadrant to the Weakening quadrant on the RRG visualization. Tech has been the strongest sector according to this methodology for quite a while. At times, it has been the only sector firmly heading northeast while most other sectors struggled elsewhere.
This rotation to more of a southwest direction, along with an arrival in the Weakening quadrant, indicates that the tech sector's dominance may be waning. Combine this with the fact that Health Care has now overtaken the XLK as the strongest sector, followed closely by Consumer Staples, and this confirms a more cautious outlook for the relative strength of Technology versus other sectors.
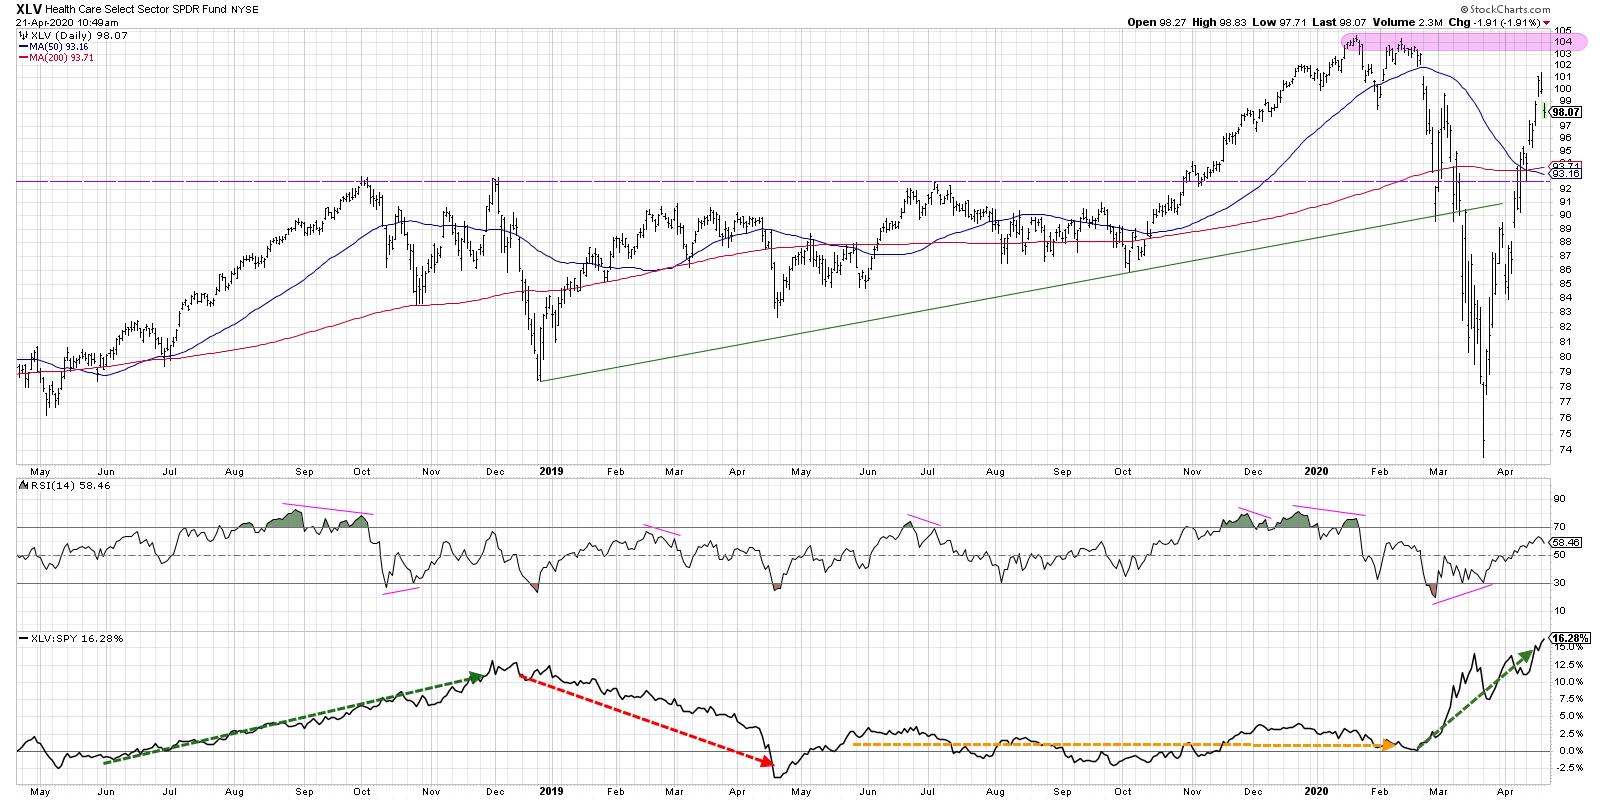
Second, we have Health Care, which has emerged as a strong relative performer over the last six weeks. And it's not just biotechnology names pushing the XLV higher - it also includes groups like pharmaceuticals and medical supplies, which have improved dramatically.
The challenge for the XLV is that it's just under a massive resistance range around $104. While the relative strength remains positive (and I would expect that to continue even with a market selloff), the overhead resistance means we would need to see a significant improvement in momentum characteristics to push the XLV to new price highs.

Finally, we have the chart of Consumer Staples. While Technology and Health Care are safely above their 200-day moving averages, the XLP has yet to accomplish this feat. In fact, although the price closed above the 200-day last week, it has so far failed to hold above this long-term smoothing mechanism.
Until we see the XLP confirm a break above the 200-day moving average, I'd still view the recent uptrend as a bear market rally within the context of a long-term downtrend. A lower high around these levels, followed by a break below the trendline using the March and April lows, could signal further downside for the XLP.
For more on these sector rotation themes, check out the video from Monday's episode of The Final Bar!
RR#6,
Dave
David Keller, CMT
Chief Market Strategist
StockCharts.com
Disclaimer: This blog is for educational purposes only and should not be construed as financial advice. The ideas and strategies should never be used without first assessing your own personal and financial situation or without consulting a financial professional.
The author does not have a position in mentioned securities at the time of publication. Any opinions expressed herein are solely those of the author and do not in any way represent the views or opinions of any other person or entity.


