 The last five months of market history are a blur for me. Back in mid-March, the S&P 500 was in free fall with no end in sight. Here we are in mid-August, and the S&P is retesting all-time highs. Trend-following is about defining the trend, recognizing shifts in the trend and anticipating potential trend changes. So now that the S&P 500 is in a raging uptrend with no apparent end in sight, what would I need to see to turn bearish?
I think many investors focus too much of their time on entry points and getting the market call correct, and not enough time managing risk and clearly defining an exit strategy before it's needed. To put another way, when the market actually stops going higher and begins to drop, that is not the time to begin developing an exit strategy!
As we were recording the latest episode of my closing bell show The Final Bar, I started to think about a bull market top checklist. What would I need to see to acknowledge that an uptrend has exhausted?
Here's a rough draft of what I'll be looking for in the coming weeks and beyond. Until I see these signs of weakness, the trend will, by definition, remain positive.
1. Failure at resistance with bearish divergences
While many individual stocks have already made new 52-week highs (about 10% of the S&P 500 members on a good day in recent weeks), the S&P 500 chart remains below its February peak.
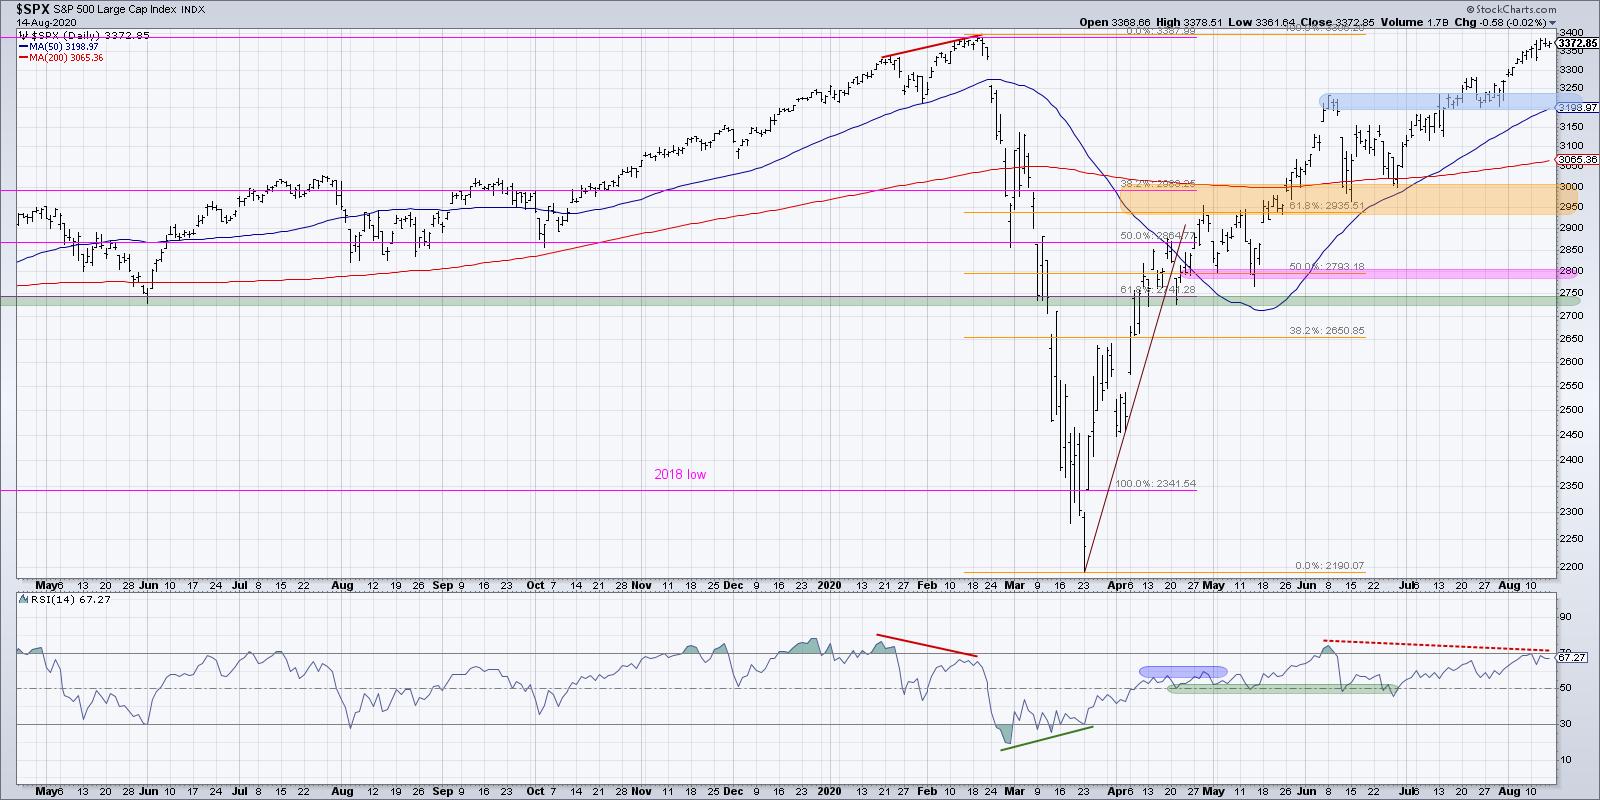
In mid-to-late July, the S&P, as well as many technology stocks, appeared to be displaying a bearish divergence with higher prices and lower RSI. While that divergence was not confirmed on charts like $AAPL, the S&P 500 chart may still be working on a bearish divergence.
It's worth noting that the S&P retesting all-time highs and accompanied by lower momentum certainly speaks to a weakening of upside pressure. We may be seeing the beginning of indication #1 of uptrend exhaustion.
2. Breakdown of support
Once the price starts to pull back, you'd want to see the price fail to hold a key support level. For the S&P 500, I'm looking at 3200-3250, which lines up with the June high as well as the July swing low. A breakdown of this key level would establish a lower low and lead me to think of further downside potential.
3. Validation of a downtrend
Once the price has broken down, at some point the trend-following indicators like MACD or PPO will confirm the downtrend by registering a sell signal. I tend to follow the weekly PPO on the S&P 500 as part of my Market Trend Model.
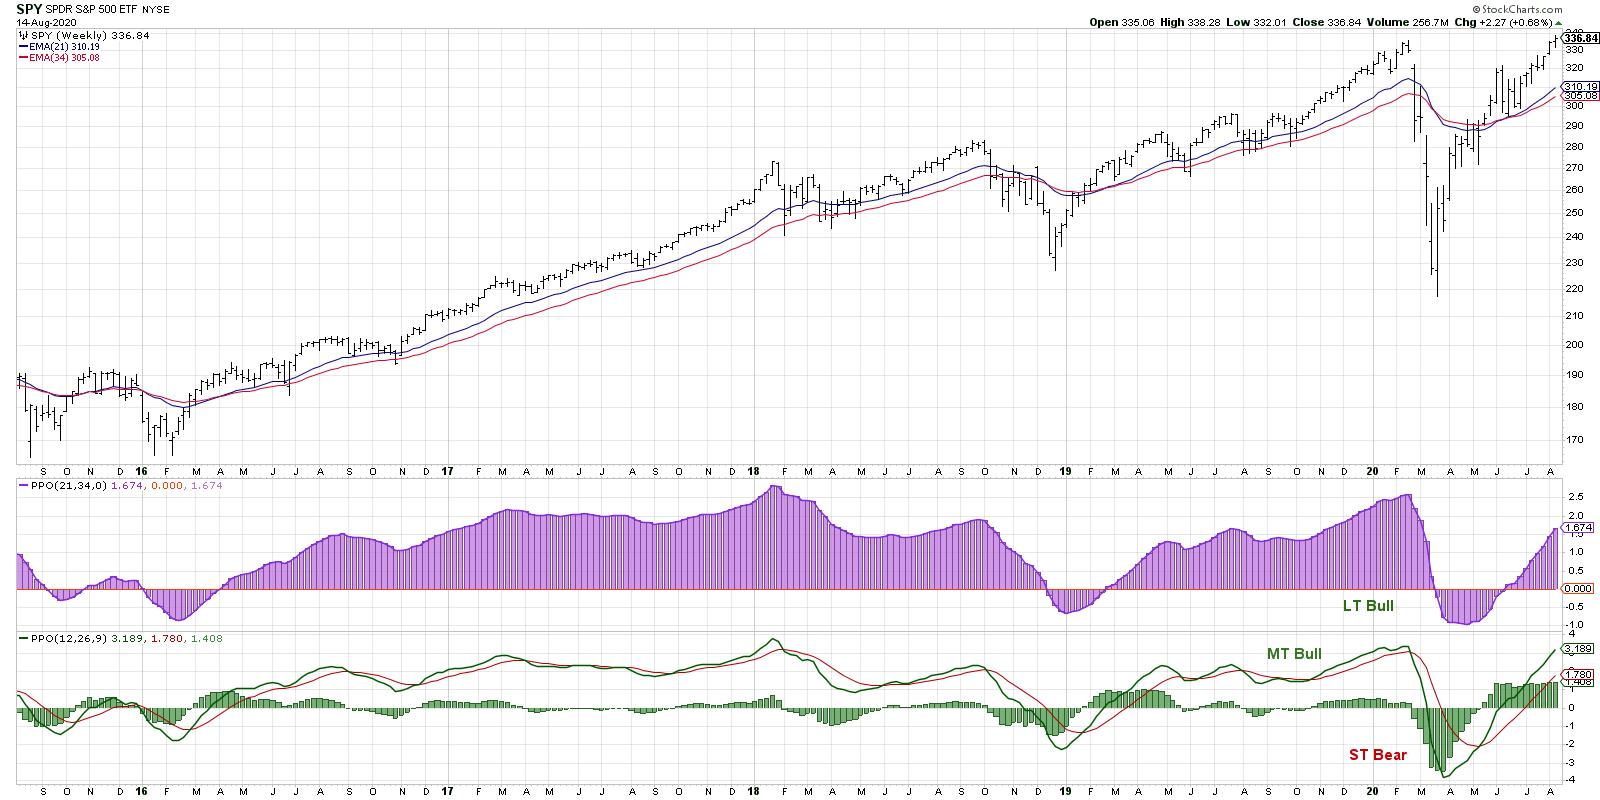
The weekly PPO turned bullish in early May and remains positive through this week. It's worth noting that this could be considered the final warning signal, as the price would have to drop significantly to register a sell signal from this indicator on the weekly charts.
Those first three steps would tend to happen in order: first a failure at resistance, then a subsequent break of support and, finally, a PPO sell signal confirming the new downtrend. These next two steps could happen at any point during the first three and would all serve to confirm the rotation in trend.
4. Deterioration in breadth
One key validation of the current bull market is the appreciation in breadth indicators. One chart I refer to often for this read is the cumulative advance-decline lines for NYSE common stocks, large-caps, mid-caps, and small-caps.
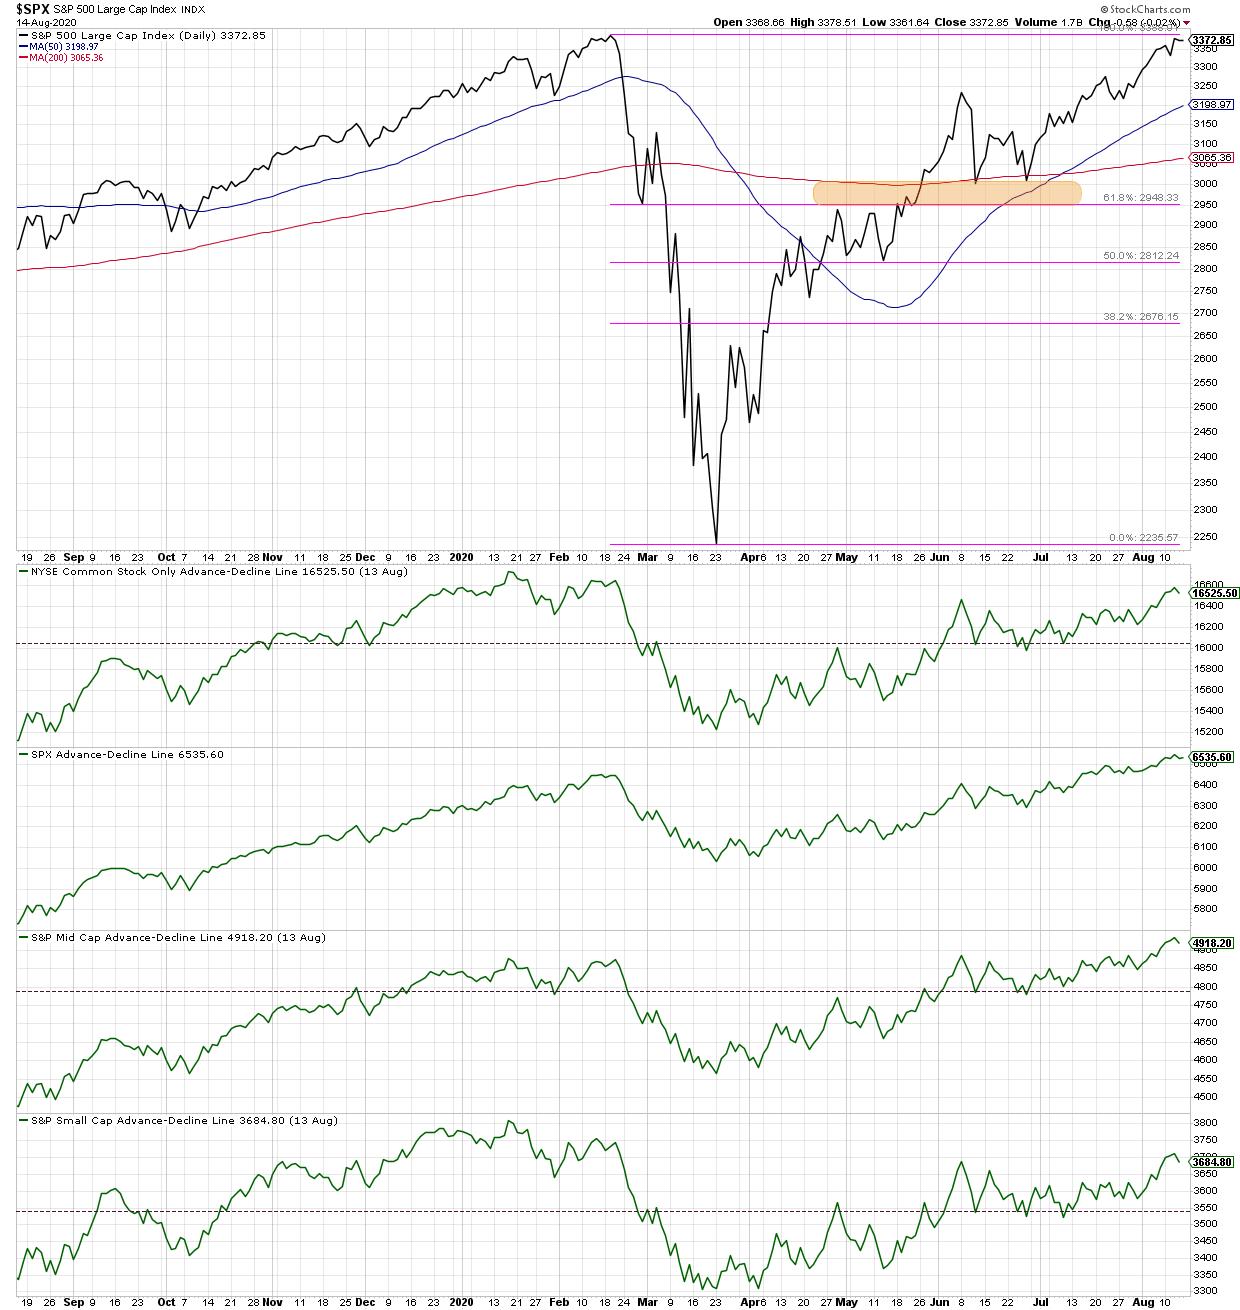
The fact that all four of these have successfully eclipsed the peak from the June market high tells me that most stocks are participating in this bull market phase. If and when these A-D line stop going higher, especially if the S&P 500 chart continues higher, that would suggest internal weakness.
It's worth noting here that usually you'll see a rotation lower in the mid-cap and small-cap breadth before large caps. This is due to investors rotating to more defensive blue-chip names instead of smaller, more speculative stocks. Jan-Feb 2020 provides a perfect example of this phenomenon.
5. Improvement in defensive sectors
Finally, I'd look for a rotation away from traditional offensive sectors like Consumer Discretionary and into more conservative sectors like Utilities and Real Estate. I think this one may be difficult this time around, only because some of the top performing names (MSFT, AMZN, AAPL come to mind) have done well as offense as well as defense.
We've seen how market pullbacks have driven investors to pile into the mega-cap tech/consumer trade, meaning many of the stocks that led the way higher to current levels may also outperform during a bear phase as well. However, the low-yield environment, combined with fear and anxiety for market downside, would likely drive investors to search for the safety and income potential of higher-yielding defensive sectors like Real Estate.
If you look back through market history, you will see several common factors surrounding market tops. Here, I'm listing five characteristics/signals/indications that would tell me an uptrend is exhausting and to prepare for downside potential.
I hope that the most important takeaway from this article is not me presenting perfect checklist of market top signals, but rather an encouragement for you to spend time now (while the market seems to continue higher unabated) to think about alternative scenarios and how you would change your positioning to adapt for a new reality.
RR#6,
Dave
Note: This article first appeared in the ChartWatchers newsletter on 8/15/20.
David Keller, CMT
Chief Market Strategist
StockCharts.com
Disclaimer: This blog is for educational purposes only and should not be construed as financial advice. The ideas and strategies should never be used without first assessing your own personal and financial situation, or without consulting a financial professional.
The author does not have a position in mentioned securities at the time of publication. Any opinions expressed herein are solely those of the author and do not in any way represent the views or opinions of any other person or entity.


