I would currently describe myself as a "cautious bull," in that I recognize that the market is trending higher, I'm prepared to follow that trend as long as it continues, and I'm always looking for some signs of potential weakness and/or exhaustion.
Over the last two weeks, I've seen many of the most negative market conditions, particularly in the area of breadth, transition from distribution phase to accumulation phase. This suggests that the recent upswing to push the S&P 500 back above 3400 is not just based on a relatively small number of mega cap names, but rather a broader increase based on widespread participation.
This brings us to the focus of today's article, the 52-week highs list.
One of the charts in my Mindful Investor LIVE ChartList shows the number of S&P 500 members making new 52-week highs and lows every day. This indicator was relatively muted after the 1st quarter market selloff, with so many stocks dropping so far from long-term highs.
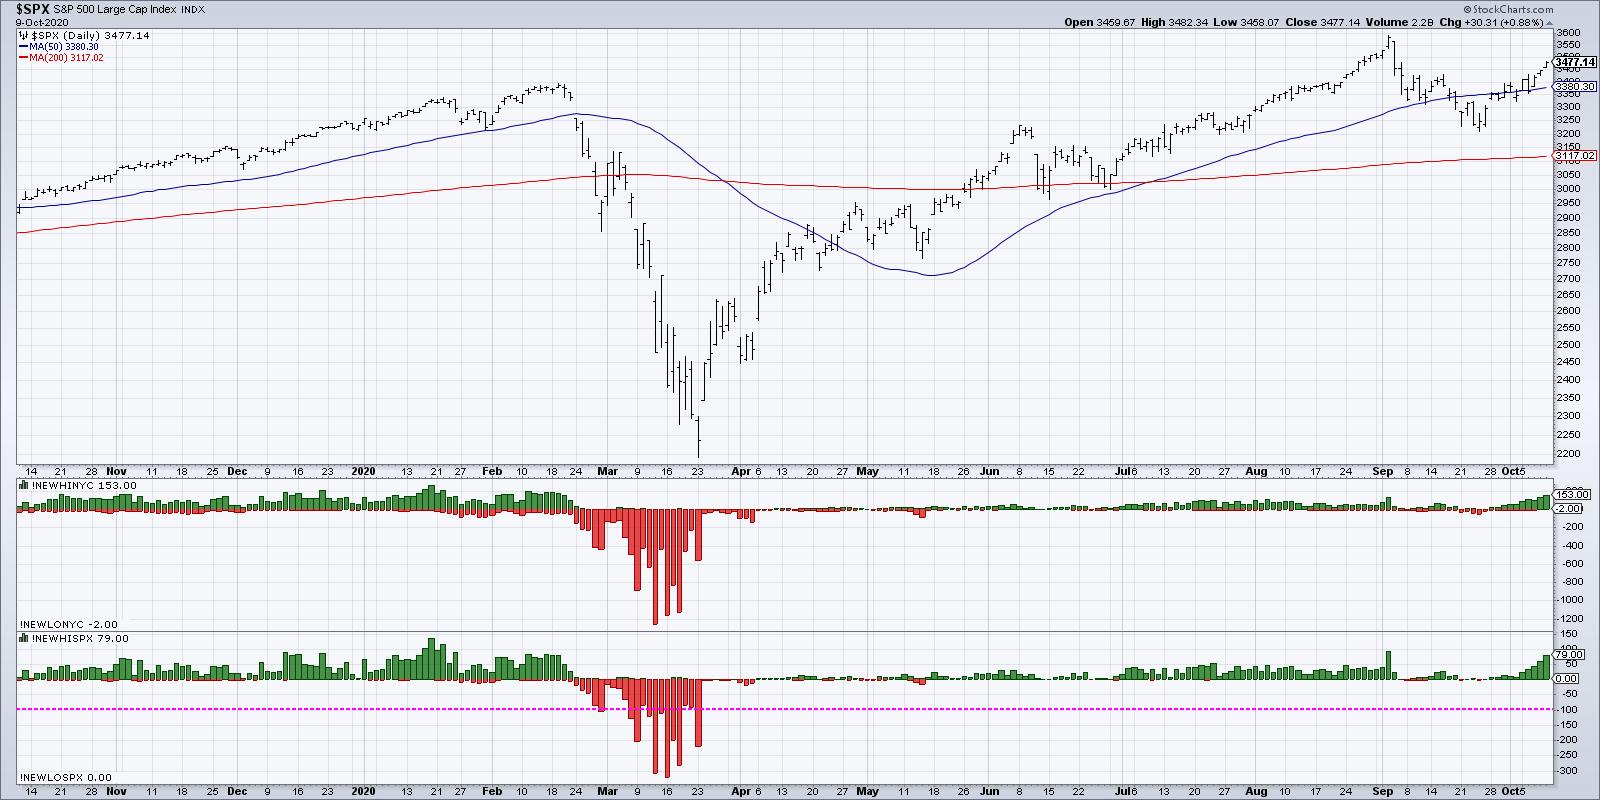
Starting in July, the number of 52-week highs expanded, as more stocks were able to eclipse their previous peaks from January or February. One of the signs of a healthy bull market is when new highs expand before the broad indexes reach new highs.
When the S&P 500 pulled back from the 3600 range in early September, the 52-week highs list immediately dried up, as should be expected. With the S&P testing support around 3200 and beginning to increase, we discussed on The Final Bar how an increase in 52-week highs would indicate greater potential for market to retest its own all-time highs.
This week, we have begun to see just that. Over 75 stocks made a new 52-week high on Friday of this week, or just over 15% of the S&P 500. That's a non-zero value and suggests that this is a broad advance led by more than a small number of stocks.
Let's look at the composition of the new highs list to see which sectors are best represented.
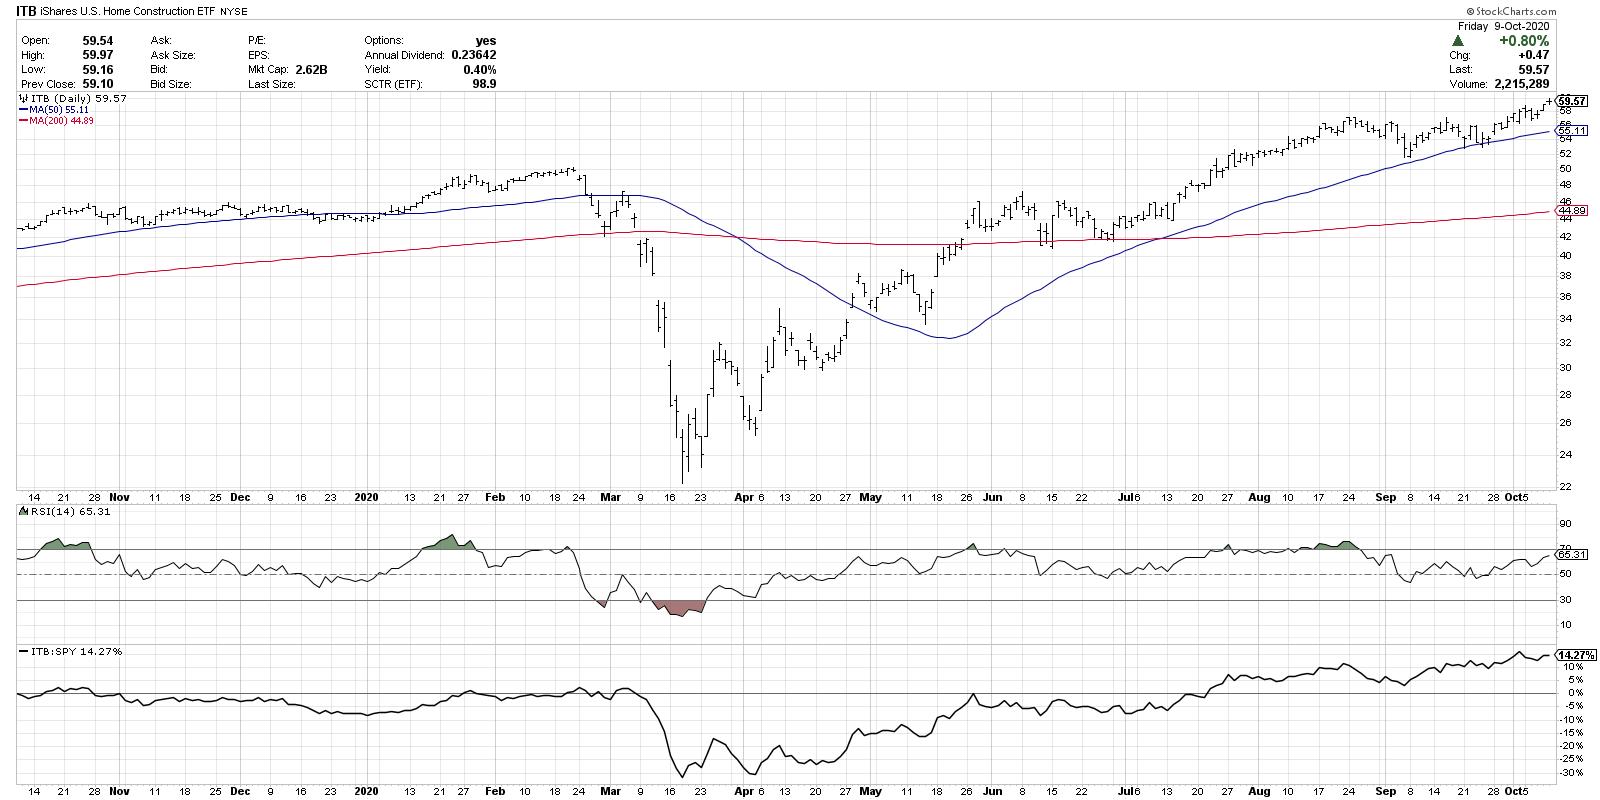
Consumer Discretionary had 13 new highs on Friday, with two groups dominating the list: homebuilders and personal products. The Home Construction ETF (ITB) includes stocks like LEN, DHI, PHM and NVR, all of which made the list this week.
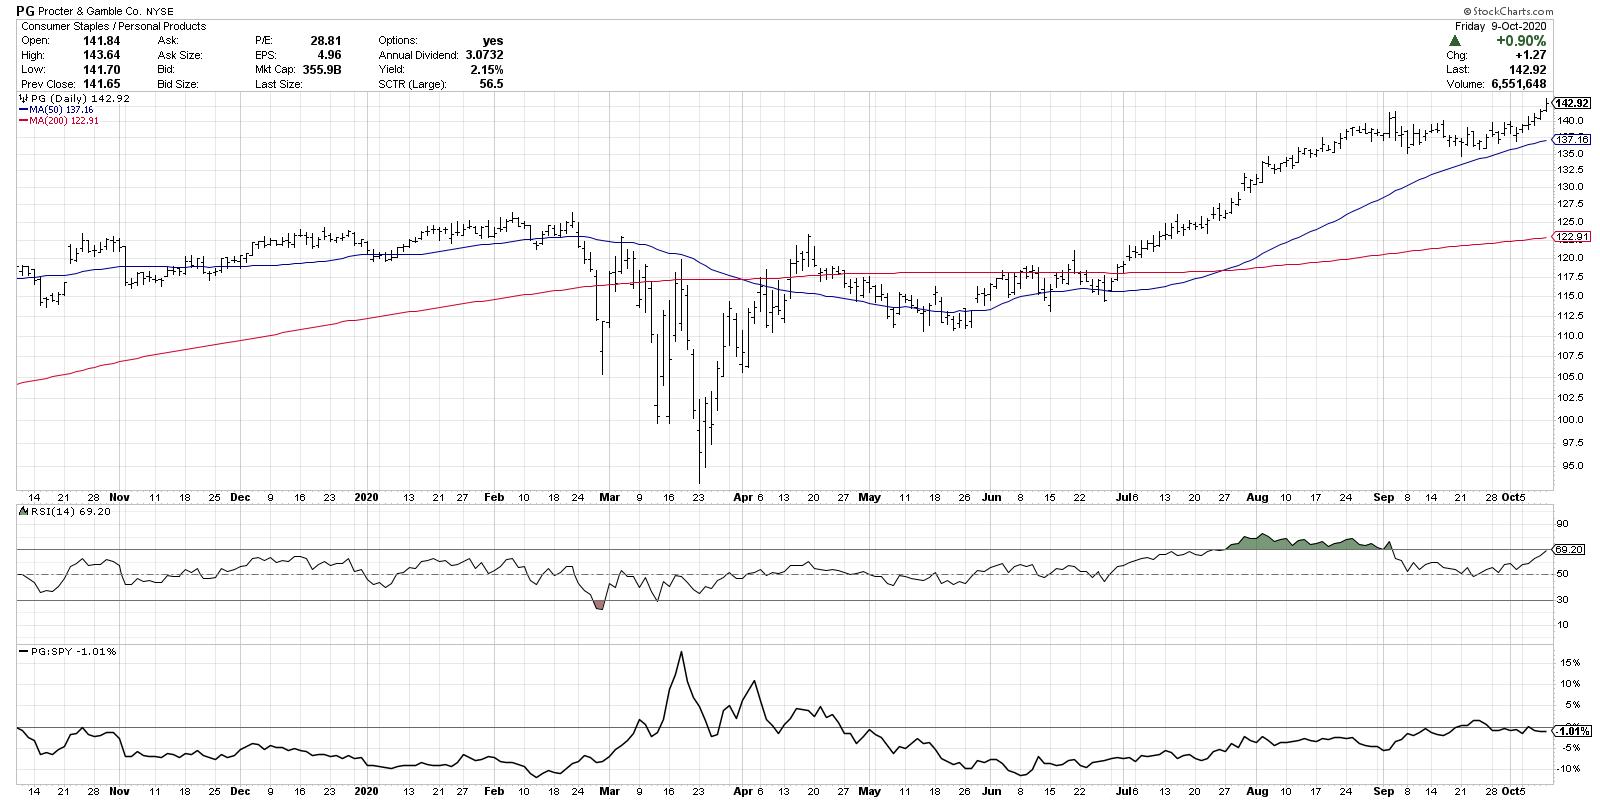
The personal products group includes stocks like PG, which we featured this week on The Final Bar as one our "3 in 3" charts. It's worth noting that, while many stocks (as well as the S&P 500 itself) broke down through their 50-day moving averages in September, PG has remained steadily above two upward-sloping moving averages.
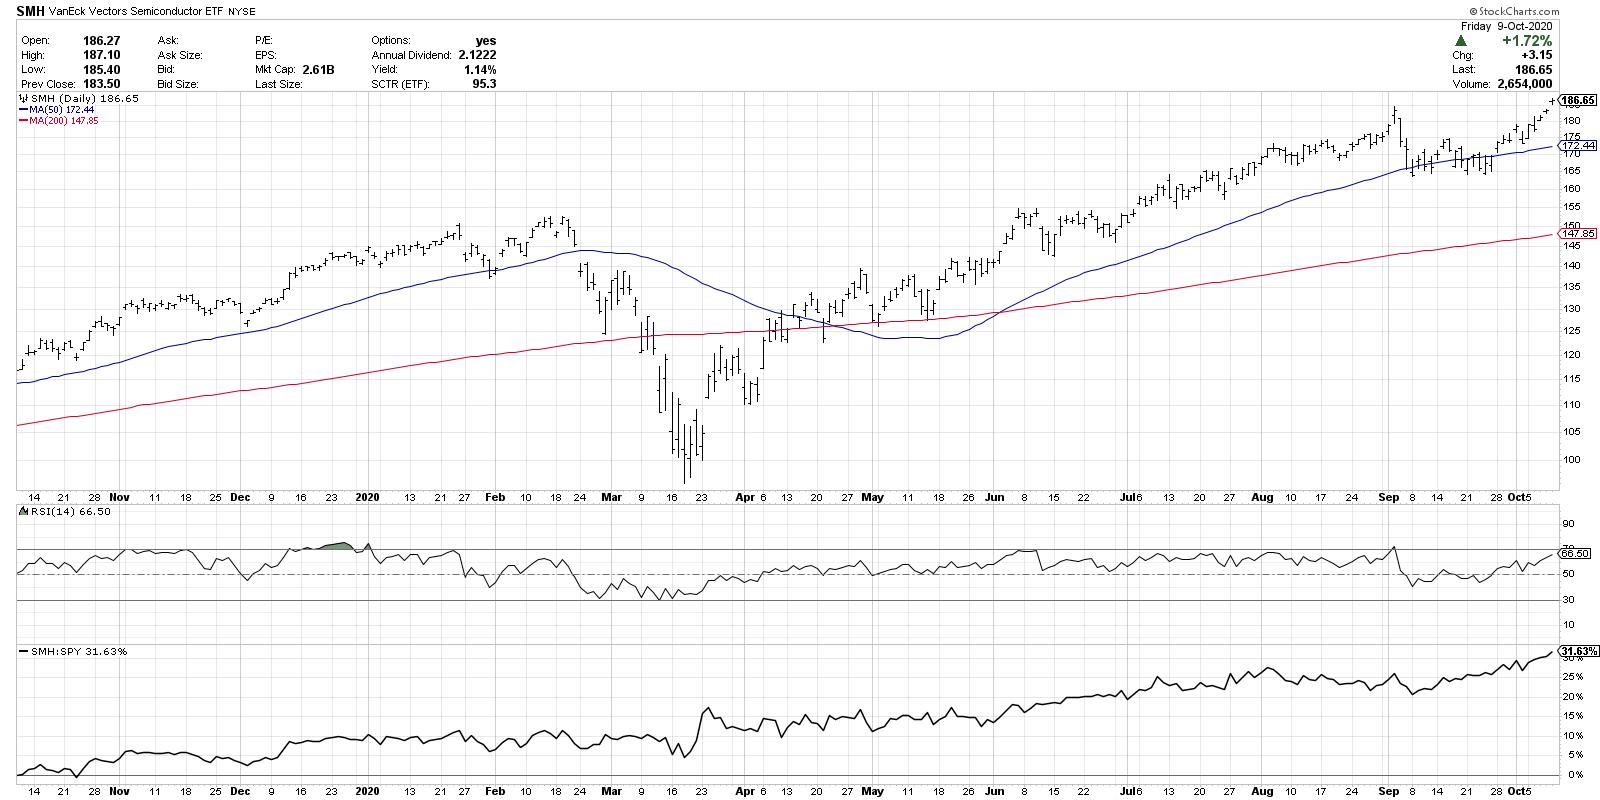
The Technology sector had 13 stocks on the new high list on Friday, with almost half of those from the semiconductor group. The strong relative performance of the semiconductor ETF (SMH) speaks to the long-term strength of this key bellwether group.
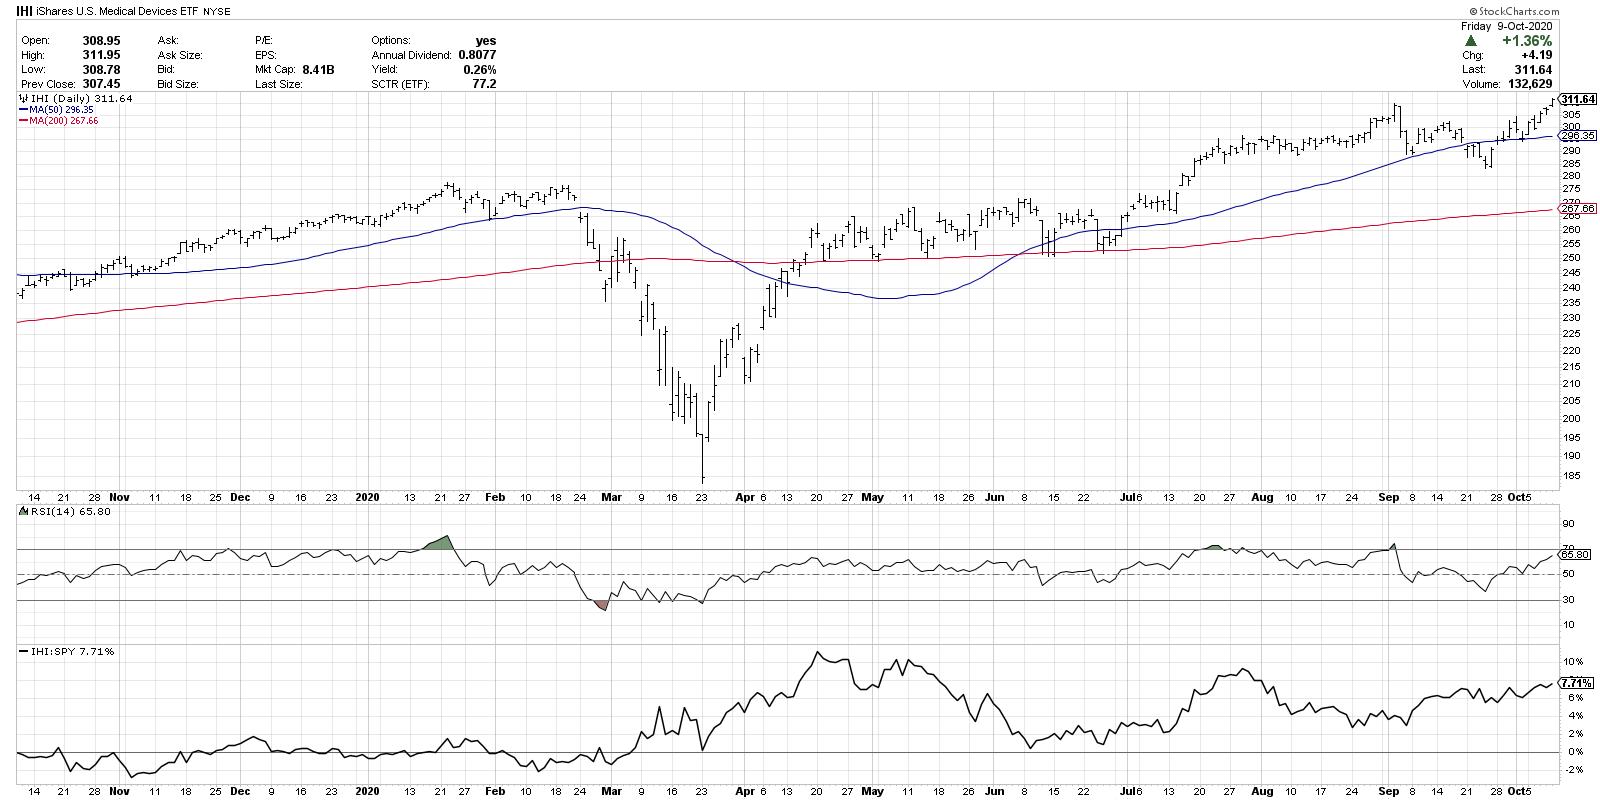
The Health Care sector included 12 stocks on this week's list, with over half of those coming from the medical equipment group. The Medical Devices ETF (IHI) provides exposure to stocks like DHR, TMO and SYK, all on the new highs list.
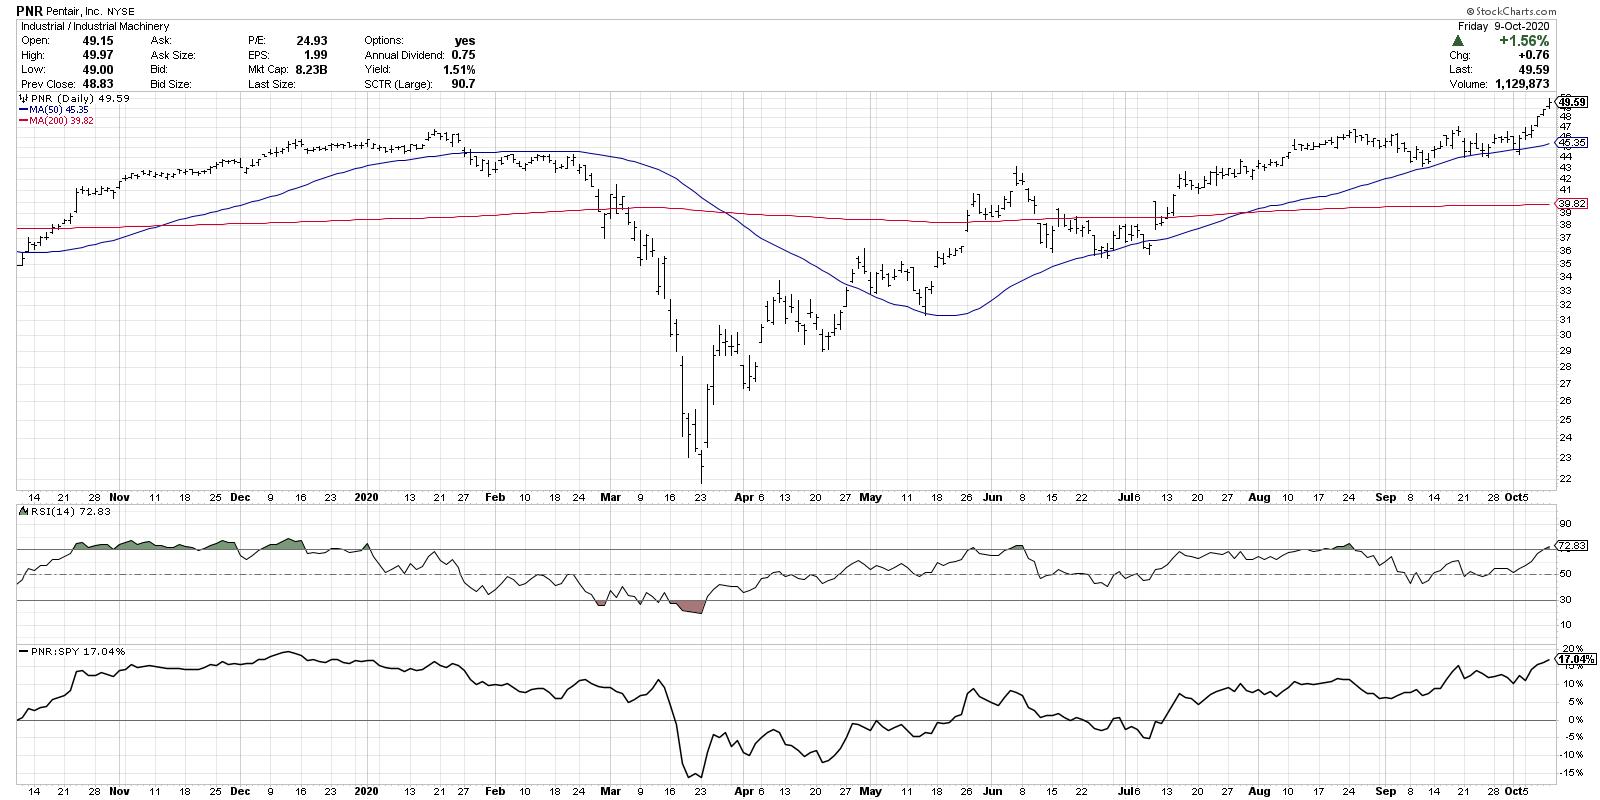
But the most represented sector on this week's new high list? Industrials, with 18 stocks from a number of different industry groups. Perhaps PNR best represents the charts in this sector, with a breakout to new swing highs above the $47 level, which also propelled the stock above its long-term high from January.
To review this list on your own, just bring up the scan engine and include these two lines in your scan:
and [Daily Close > Yesterday's Daily MAX(262,Daily Close)]
and [group is SP500]
You can also check out the Predefined Scans page, which includes 52-week highs and lows among many other technically-oriented screen ideas.
As the market once again approaches all-time highs, an increasing number of new highs confirms the broad-based recovery as opposed to narrow leadership. By digging deeper into the stocks and groups that comprise this list, you may be able to identify the names leading the way higher into year-end and beyond.
RR#6,
Dave
David Keller, CMT
Chief Market Strategist
StockCharts.com
Disclaimer: This blog is for educational purposes only and should not be construed as financial advice. The ideas and strategies should never be used without first assessing your own personal and financial situation, or without consulting a financial professional.
The author does not have a position in mentioned securities at the time of publication. Any opinions expressed herein are solely those of the author, and do not in any way represent the views or opinions of any other person or entity.


