 The S&P 500 wrapped a rather volatile week by settling in at the upper end of the 3200-3600 range. One key breadth indicator shows clear similarities to the bull run in early October, and also provides a prescription for bulls looking for validation of further upside.
*** This article originally appeared in our ChartWatchers newsletter on Saturday morning and while Monday's upswing certainly puts S&P 3600 in play, it also very much validates the positive breadth argument we provided below!
Breadth equals participation, which means it's a way to measure how the individual stocks that make up a broad index are performing relative to the index itself. For me, my order of operations is Price, then Breadth, then Sentiment.
First, let's establish what the price is doing in terms of defining the trend direction. Second, let's review the breadth characteristics and see how the components of the index are performing and whether there is narrow or broad participation in the trend.
A "narrow" advance suggests that, although the index is moving higher, it's a relatively small number of names that are doing the heavy lifting. On Wednesday of this week, we saw an example of a narrow advance, with the market moving higher, but just over 50% of NYSE listed stocks closing higher for the day.
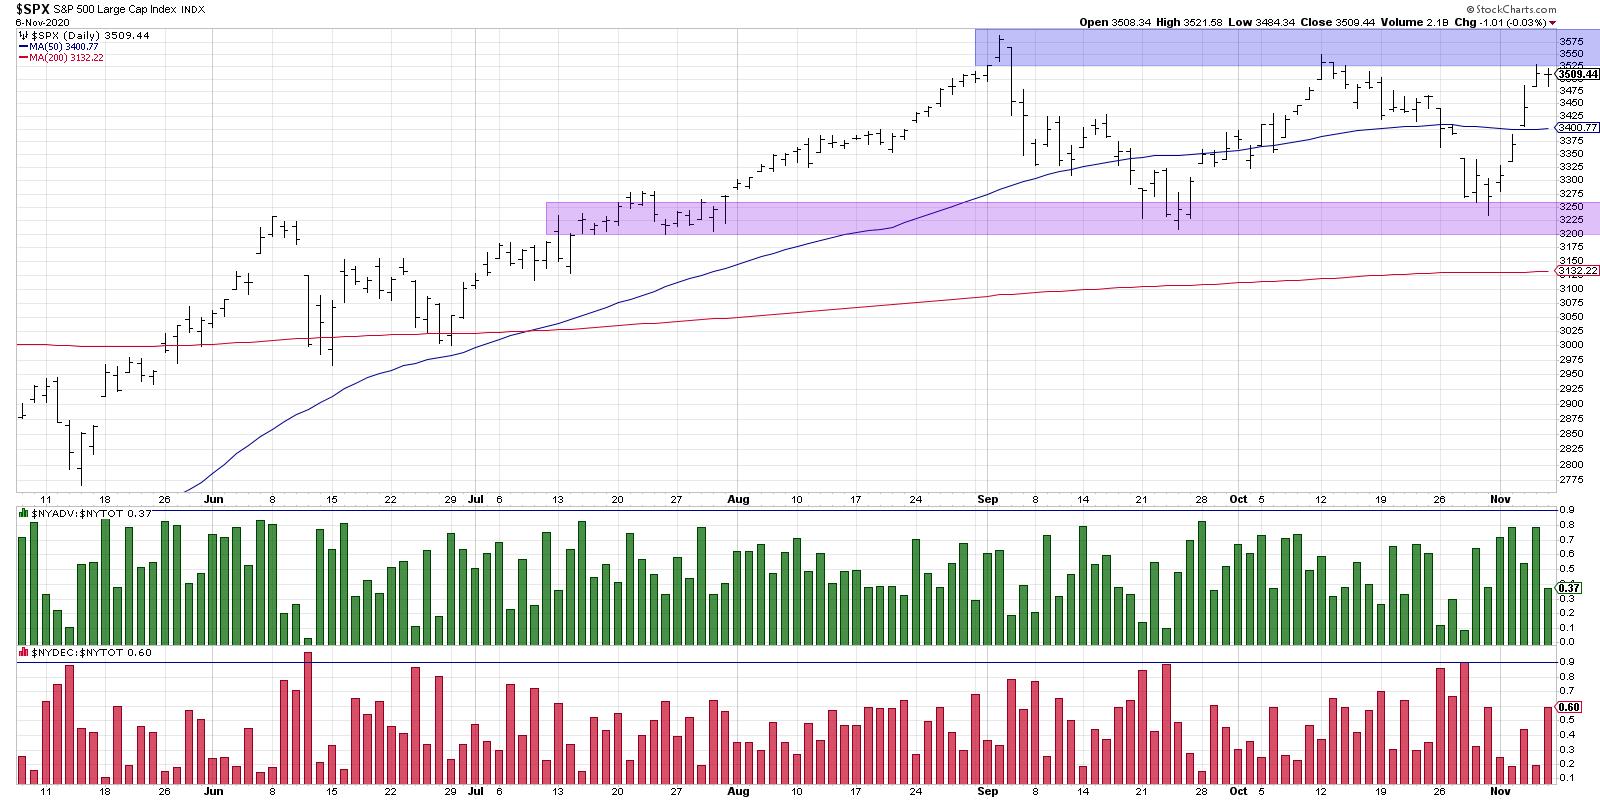
Even though the market finished solidly in the green, only half of the stocks, and indeed half of the 11 S&P sectors, finished positive for the day. This was a large move driven by a relatively small number of stocks, mostly the FANMAG names.
If you look at Thursday's bar and follow down to the panel at the bottom, you'll see that about 80% of stocks closed higher on that trading day. This is a good illustration of a "broad" advance, where the market moves up and is supported by an overwhelming number of stocks doing the same.
(To be clear, we're using these days purely for example purposes. This sort of discussion of broad and/or narrow advances is usually used to describe a pattern of these sorts of days over time.)
That brings us to a key breadth chart to watch going into next week. As the S&P 500 approached the resistance range around 3550-3600, we saw an expansion of new 52-week highs. This illustrates that, while the S&P 500 itself has not made a new 52-week high, about 15% of the S&P members were able to do so on Thursday of this week.
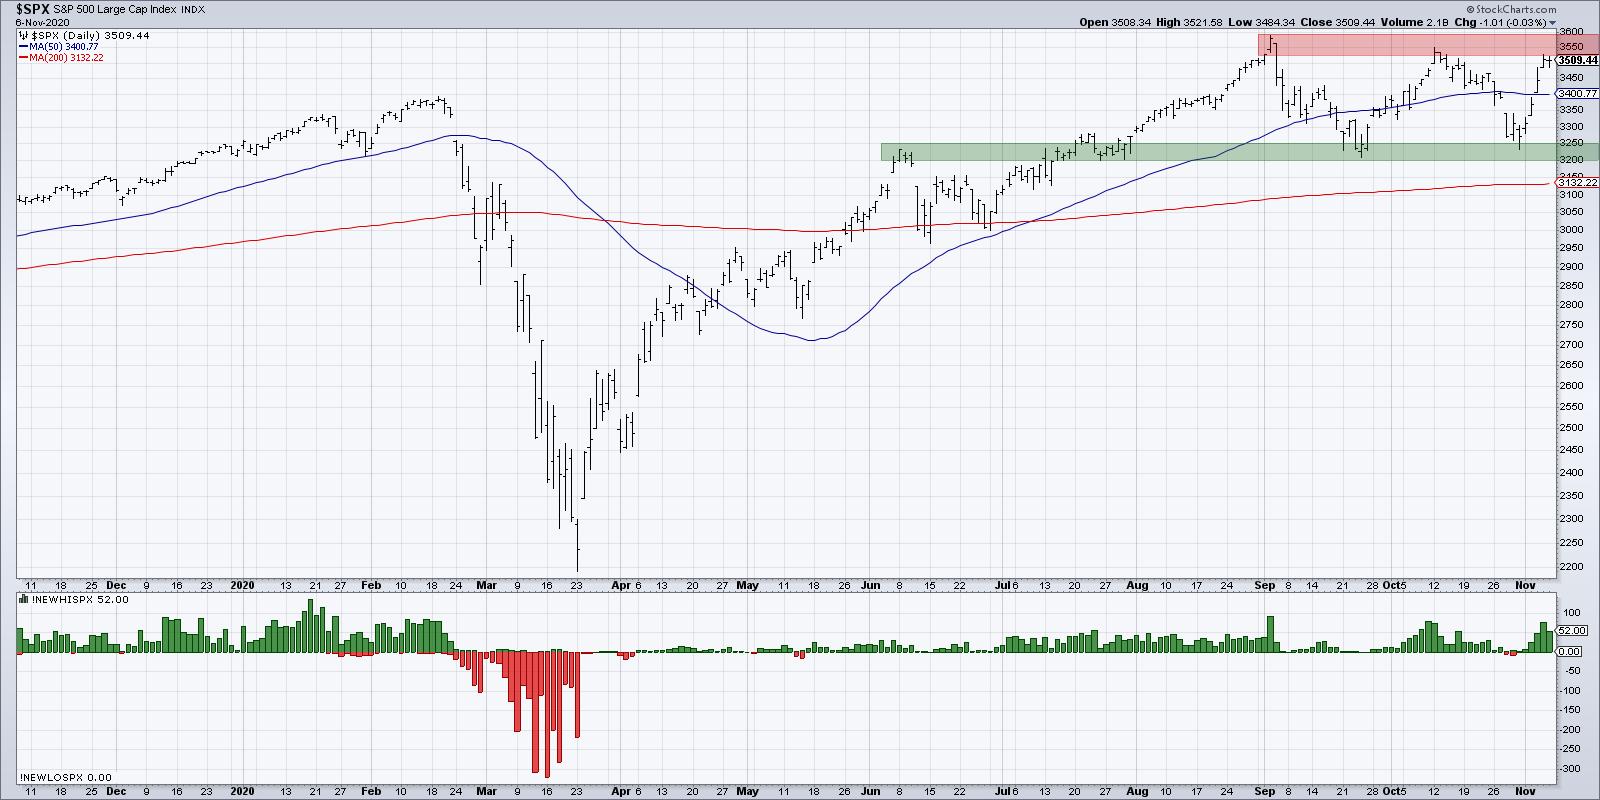
When the market is moving toward new highs, a healthy bull market means that plenty of individual stocks are making new highs before the index. These are the leadership names, breaking new ground and pushing the rest of the market higher.
As the S&P rallied in early October, we saw an increase in new 52-week highs as an increasing number of names were moving above their own resistance levels. We're now seeing a very similar pattern to early October, with the S&P testing the same resistance range and a similar pattern of increasing new highs. If this proves to be another failed bid for a broad market breakout, the new highs will evaporate as stocks retreat and the index "backs and fills" in the 3200-3600 range. From everything I'm seeing, including plenty of macro headwinds out there, this seems the most likely scenario.
If, however, the S&P is able to break above 3600 and the new highs reading continues to appreciate, this would speak to a broad advance with strong participation, along with strong likelihood that the market pushes ever higher into year-end.
For now, it's all about the resistance range and the new highs list. Are there enough leading stocks to push this market to uncharted territory?
RR#6,
Dave
David Keller, CMT
Chief Market Strategist
StockCharts.com
Disclaimer: This blog is for educational purposes only and should not be construed as financial advice. The ideas and strategies should never be used without first assessing your own personal and financial situation, or without consulting a financial professional.
The author does not have a position in mentioned securities at the time of publication. Any opinions expressed herein are solely those of the author, and do not in any way represent the views or opinions of any other person or entity.


