My weekly investment routine involves a review of key sentiment indicators every Thursday. This is mainly because the survey data I review is usually updated on Wednesday and Thursday of each week, so it's a perfect time to reflect on survey data (how investors are voting with their voice) versus price performance (how investors are voting with their capital).
A number of sentiment indicators have flashed somewhat bearish readings in recent months as the major indexes have pulled back in the 10-20% range. But that's nothing compared to the essentially bombed-out sentiment readings I saw this week.
One of the most popular surveys out there is the American Association of Individual Investors (AAII) Survey. Every week, AAII members are invited to cast a ballot of bullish, neutral or bearish on stocks for the next six months. While any survey has its imperfections, I like the fact that this survey has been around for so long in a fairly consistent format. As you'll see later in the article, you can review how the numbers played out during previous bull and bear market cycles, even decades in the past!
The current chart looks like this:
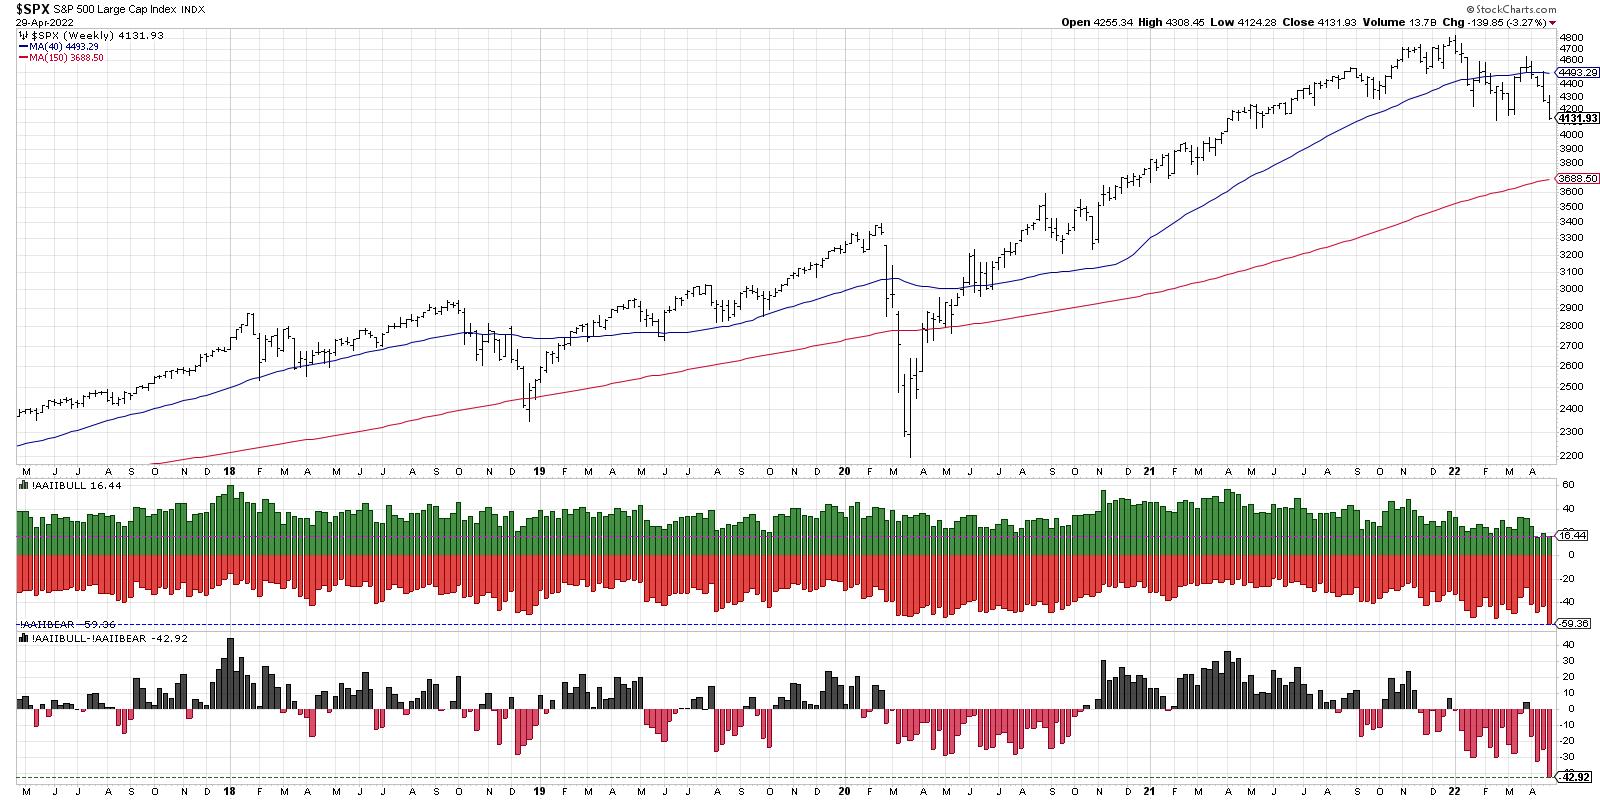
The green bars represent the percent of respondents who were bullish, while the red bars show the percent of bearish respondents. The bottom panel shows the spread between the two, bullish minus bearish, and the neutral responses are not included here.
My first response this morning was that, besides two weeks ago, we have not seen such a low level of bullish votes (only 16%) in over five years. I also noticed that the bearish number, at almost 60%, is the lowest we've seen in over five years. Finally, the spread between the two currently sits around -43%, with bears far outnumbering bulls. This is also well below the range of the previous five years.
So, basically, the current move has been so severe that you have no historical parallel without bringing in more data. I have found that when this happens on your chart, you are experiencing a market where a deep historical analysis is worthwhile.
Let's bring in 20 more years of data, which will take us back to the late 1990s.

This shows the current bearish readings are indeed some of the most severe we've seen even going back to the pre-2000s secular bull market. The only other time bullish sentiment has been this low was in 2016. The bearish reading of almost 60% was only seen at the 2003 market low, the 2006 pullback, and much of 2008 going into the 2009 market bottom. The spread of bulls to bears has only been this negative (-43%) one other time in the last 25 years, and that was at the 2009 market low.
Now let's dig into each of these periods in a little more detail.
It's interesting to me that the sentiment in March 2003 was more bearish than in the third quarter of 2002, which was the actual bottom of that cyclical bear market phase from 2000-2002. The 2003 low was a retest of the 2002 lows, but the prospect of moving to new lows for the cycle made investors incredibly bearish.
The 2006 observation is a compelling one, in that it occurred during a brief pullback during a cyclical bull market phase. Similar pullbacks in 2005 saw somewhat bearish sentiment, but not the extreme seen in 2006. The market quickly recovered and went on to new multi-year highs soon after.
The 2008-2009 observation is perhaps the most concerning, because the first leg down in the first quarter of 2008 saw a very similar pattern of bearish sentiment. As you can see, the sentiment remained excessively bearish for over a year, culminating in the quite negative readings in March 2009.
I was taught that investors tend to be excessively bearish at market bottoms and overly bullish at market tops. But a review of the AAII survey data over the last 25 years shows that this has indeed occurred... but only some of the time. In certain cases, like the 2008-2009 cyclical bear market, excessively bearish sentiment was just the beginning of a long and painful journey to the downside.
Want to digest this article in video format? Head over to my YouTube channel!
RR#6,
Dave
P.S. Ready to upgrade your investment process? Check out my YouTube channel!
David Keller, CMT
Chief Market Strategist
StockCharts.com
Disclaimer: This blog is for educational purposes only and should not be construed as financial advice. The ideas and strategies should never be used without first assessing your own personal and financial situation, or without consulting a financial professional.
The author does not have a position in mentioned securities at the time of publication. Any opinions expressed herein are solely those of the author, and do not in any way represent the views or opinions of any other person or entity.


