2022 has been a clear bear market phase for risk assets, particularly the equity markets. The signs were building in January, seemed validated by a new low in February, then were absolutely confirmed with the failed breakout above 4600 in late March.
Somewhere in the first three months of the year, investors appear to have widely transitioned from the "disbelief" phase ("There's no way this market is going lower.") to the "acceptance" phase ("Oh my, this is definitely a bear market!"). The challenge at this point? Bear market rallies, like the one we experienced this week.
Countertrend rallies in bear markets can be usually described as sudden, severe and seductive. They happen suddenly, with the market making new swing lows one day and then ripping back to the upside immediately after. This particular rally was punctuated by hammer candles, along with other bullish candlestick patterns. They are also usually severe, meaning they make up lots of ground in a relatively small amount of time. And why do they tend to bounce higher so quickly?
That's the seductive nature of these quick countertrend rallies. The "FOMO" is palpable as investors are afraid of missing the bottom. As if 200 S&P points would be the difference between an amazing year and a mediocre year when you look back at 2022!
Once this sudden influx of buyers has done their buying, the market sort of wakes up to the fact that conditions really haven't changed much in the last couple weeks. All of the headwinds that have caused stocks to broadly decline from January into May are still there.
The Fed has transitioned from an accommodative policy to a policy much less ideal for risk assets. Inflation is still an issue that impacts consumers, as evidenced by the number of companies in the past couple weeks that have stressed its influence on their outlooks.
So what is actually happening here? To be honest, this week's rally just makes sense. The S&P 500 reached the 38.2% retracement of the March 2020-January 2022 uptrend almost exactly. I would have been incredibly surprised if we had not rallied off the 3815-3820 level.
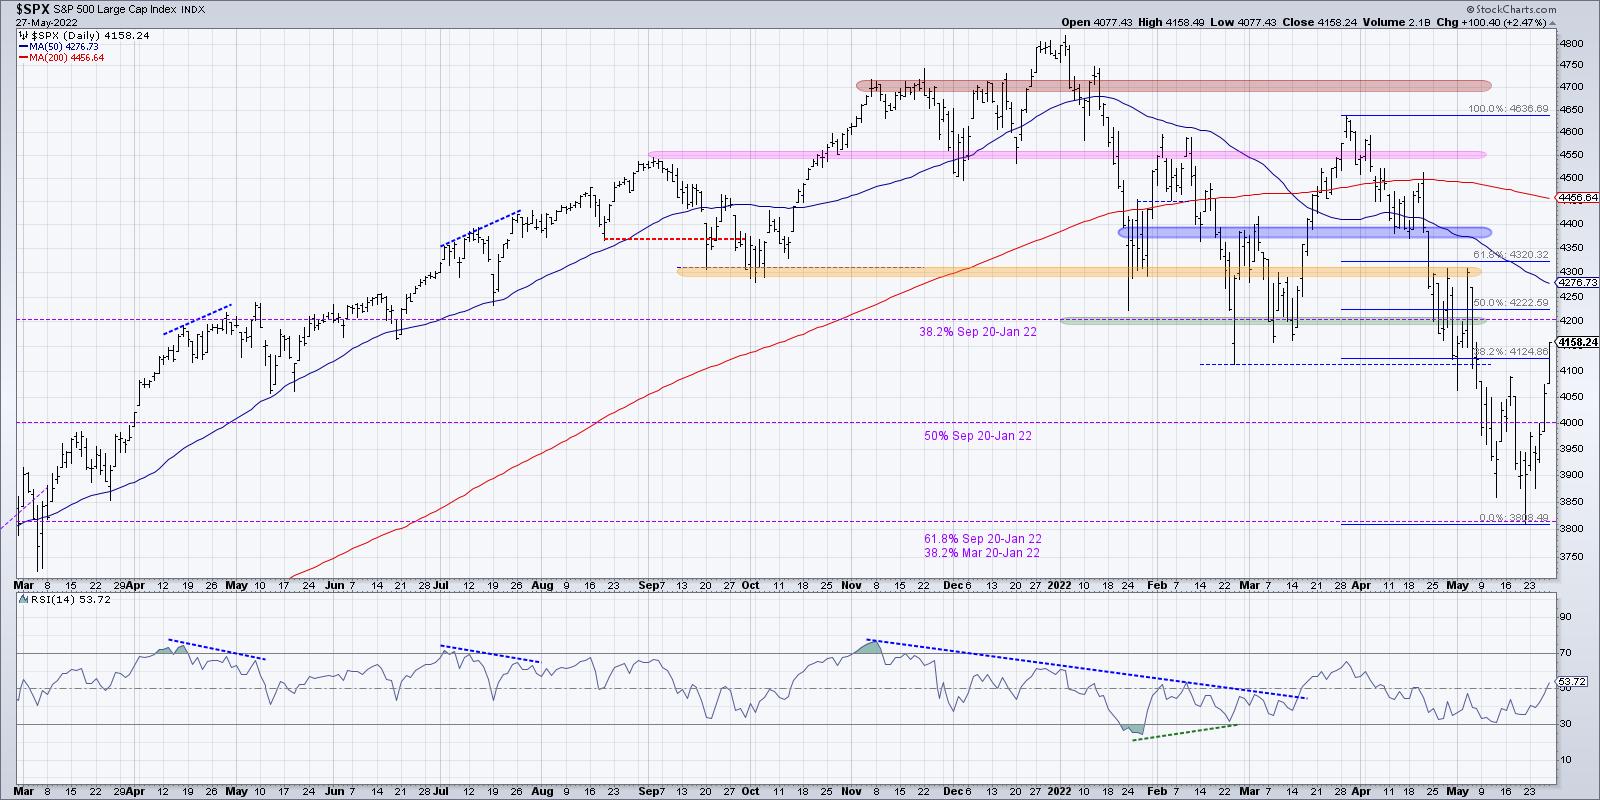
How do we differentiate a bear market rally from the beginning of a more meaningful recovery for the S&P 500? First, we would need to see the SPX break above key resistance levels. And I would have to admit that Friday's close above 4125 is quite impressive, as it takes the index above a 38.2% retracement of the March to May downtrend.
Now I am focused on the 50-day moving average (around 4275) and the 61.8% retracement level (4320). If we see the S&P 500 close break above 4320, then I believe you'd have to label this wave as something other than a bear market rally.
Second, I would have to see an influx of positive momentum. While this week ended on a high note, the daily RSI still sits below 54 for the S&P 500. During bear market phases, the RSI tends to stall out around 60 in a rally phase. The peak from late March is a great example of what tends to happen. So a break above the previously-mentioned resistance, along with the RSI reaching above the key 60 level, would confirm enough upside momentum that a more bullish outlook could be warranted.
Finally, you would have to see an improvement in breadth conditions. When I look at the cumulative advance-decline lines for the major equity averages, I can't help but notice that the S&P 500 A-D line was the only one that did not make a new low in May.
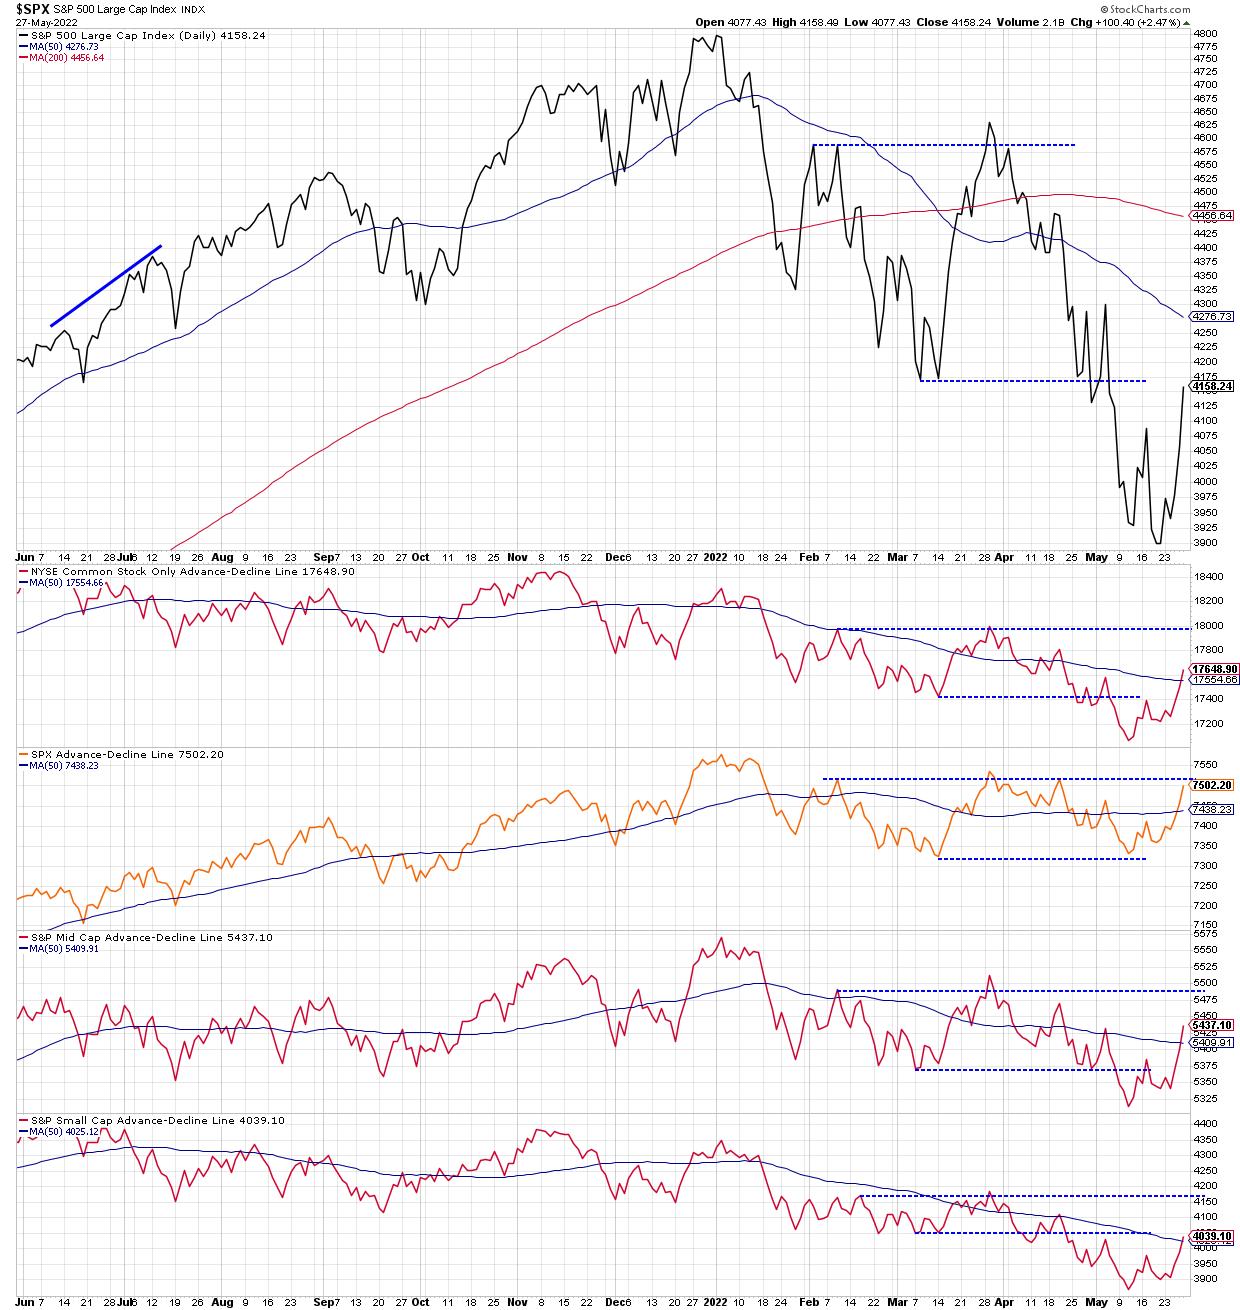
Now, this large cap breadth indicator is threatening to eclipse its higher from February and March. If these four advance-decline lines can make new swing highs, then we can say that this is a broader advance and not just a quick upside reversal.
Bear market rallies can be challenging. Just remember, make short-term decisions using short-term data, and long-term decisions using long-term data!
RR#6,
Dave
P.S. Ready to upgrade your investment process? Check out my YouTube channel!
David Keller, CMT
Chief Market Strategist
StockCharts.com
Disclaimer: This blog is for educational purposes only and should not be construed as financial advice. The ideas and strategies should never be used without first assessing your own personal and financial situation, or without consulting a financial professional.
The author does not have a position in mentioned securities at the time of publication. Any opinions expressed herein are solely those of the author, and do not in any way represent the views or opinions of any other person or entity.
