When the market is in a confirmed downtrend, which I certainly believe it is, your investor game needs to rotate from a focus on capital growth to a focus on capital preservation. As long as the trend remains negative, and the price momentum remains bearish, there is no real reason to consider taking on additional risk.
Where would we expect to see price momentum improve? I always go back to the Sam Stovall model of sector rotation. Once equities are in an established bear phase, and economic conditions begin to deteriorate, it's all about the leadership out of the eventual market bottom. What tends to perform well as the market bottoms out? The growthy sectors like Technology and Consumer Discretionary.
That's brings us to today's example, which includes a fantastic illustration of using RSI ranges to determine the overall market phase. From mid-2020 through the end of 2021, Microsoft (MSFT) was in a clear uptrend pattern of higher highs and higher lows.
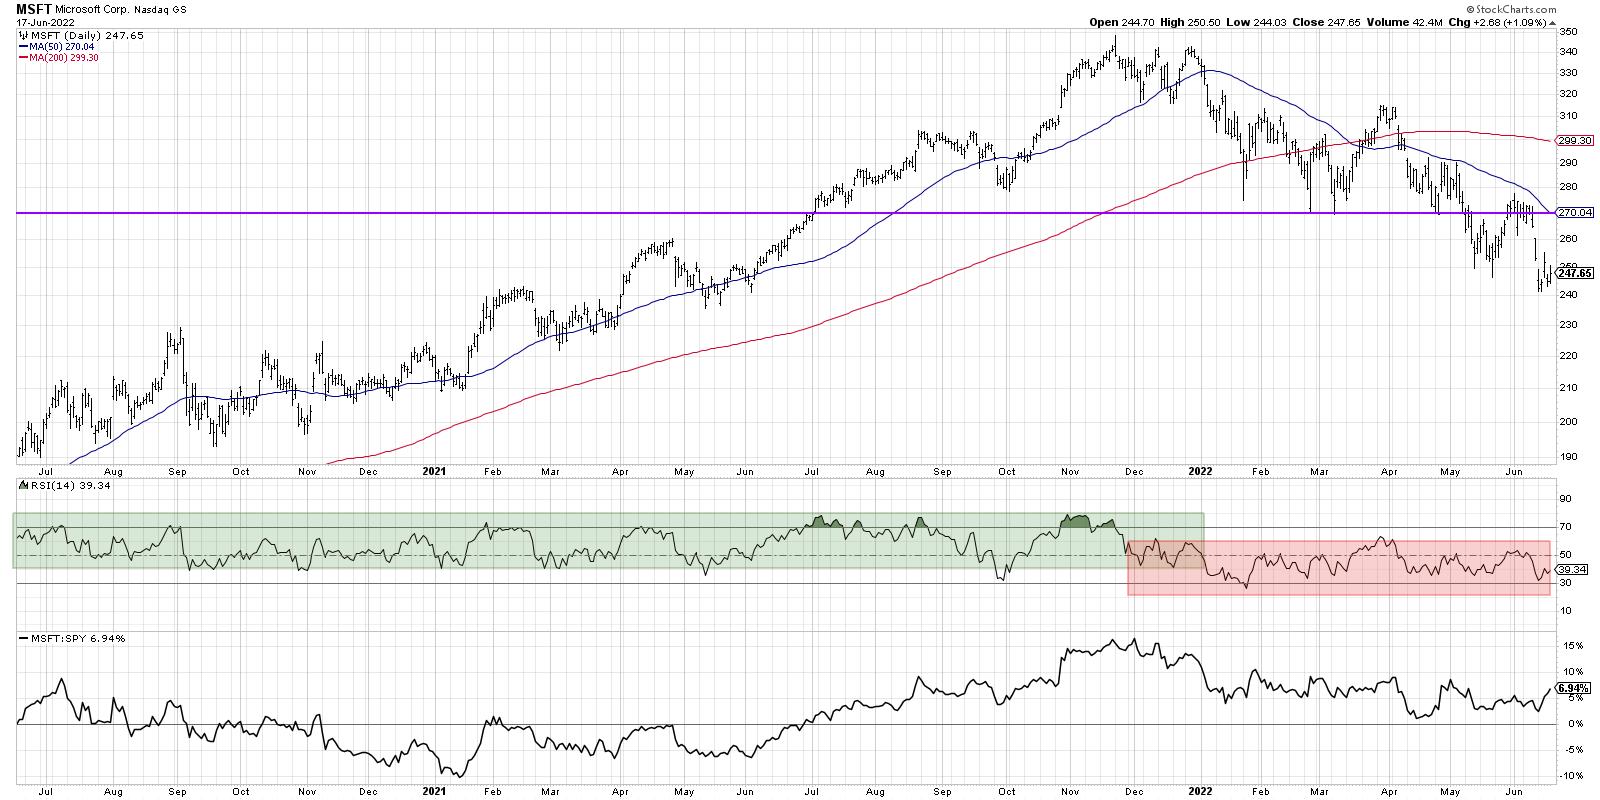
The RSI during this period tended to become overbought on upswings and rarely reached below 40 on any pullbacks. This particular phenomenon, where the entire range of the RSI shifts higher during a bull move, is one of the reasons why Connie Brown's fantastic book Technical Analysis for the Trading Professional is featured on my recommended reading list.
Now look what happened in December 2021. The RSI basically hovered around the 50 level for about four weeks, bouncing between 40 and 60. This pattern basically indicates an absence of price momentum, or a market in equilibrium. Then, in January of this year, the RSI went below 40 on the way to becoming oversold in late January. Even though MSFT has rallied a number of times during the bear market of 2022, the RSI has never reached much above the 60 level.
The entire RSI range tends to shift lower during a downtrend, often becoming oversold on down legs and rarely reaching above 60 on price bounces.
Going to back to Sam Stovall's work on sector rotation, I would want to see charts like MSFT improve to confirm that the broader bear market in stocks was nearing an end. Without strong performance from FAANG stocks like Microsoft, there just isn't enough market cap to push the S&P 500 and Nasdaq to new swing highs. So that means that when MSFT bounces (which it certainly will at some point), I'll be watching this chart to see if the RSI reaches above 60. That would indicate a potential bullish rotation, an exhaustion of sellers, and an influx of buyers.
Until charts like MSFT see a dramatic improvement in price momentum using RSI, the bear market phase is very much still in play.
RR#6,
Dave
P.S. Ready to upgrade your investment process? Check out my YouTube channel!
David Keller, CMT
Chief Market Strategist
StockCharts.com
Disclaimer: This blog is for educational purposes only and should not be construed as financial advice. The ideas and strategies should never be used without first assessing your own personal and financial situation, or without consulting a financial professional.
The author does not have a position in mentioned securities at the time of publication. Any opinions expressed herein are solely those of the author, and do not in any way represent the views or opinions of any other person or entity.


