Semiconductors are what I consider a "bellwether" group. These companies truly provide the backbone of the modern information economy, so, when these stocks are doing well, the economic conditions are most likely strong. The SMH is featured a number of times on my Mindful Investor Live ChartList, mainly because strong semiconductors usually mean strong stocks in general.
So what does it mean when these stocks are struggling?
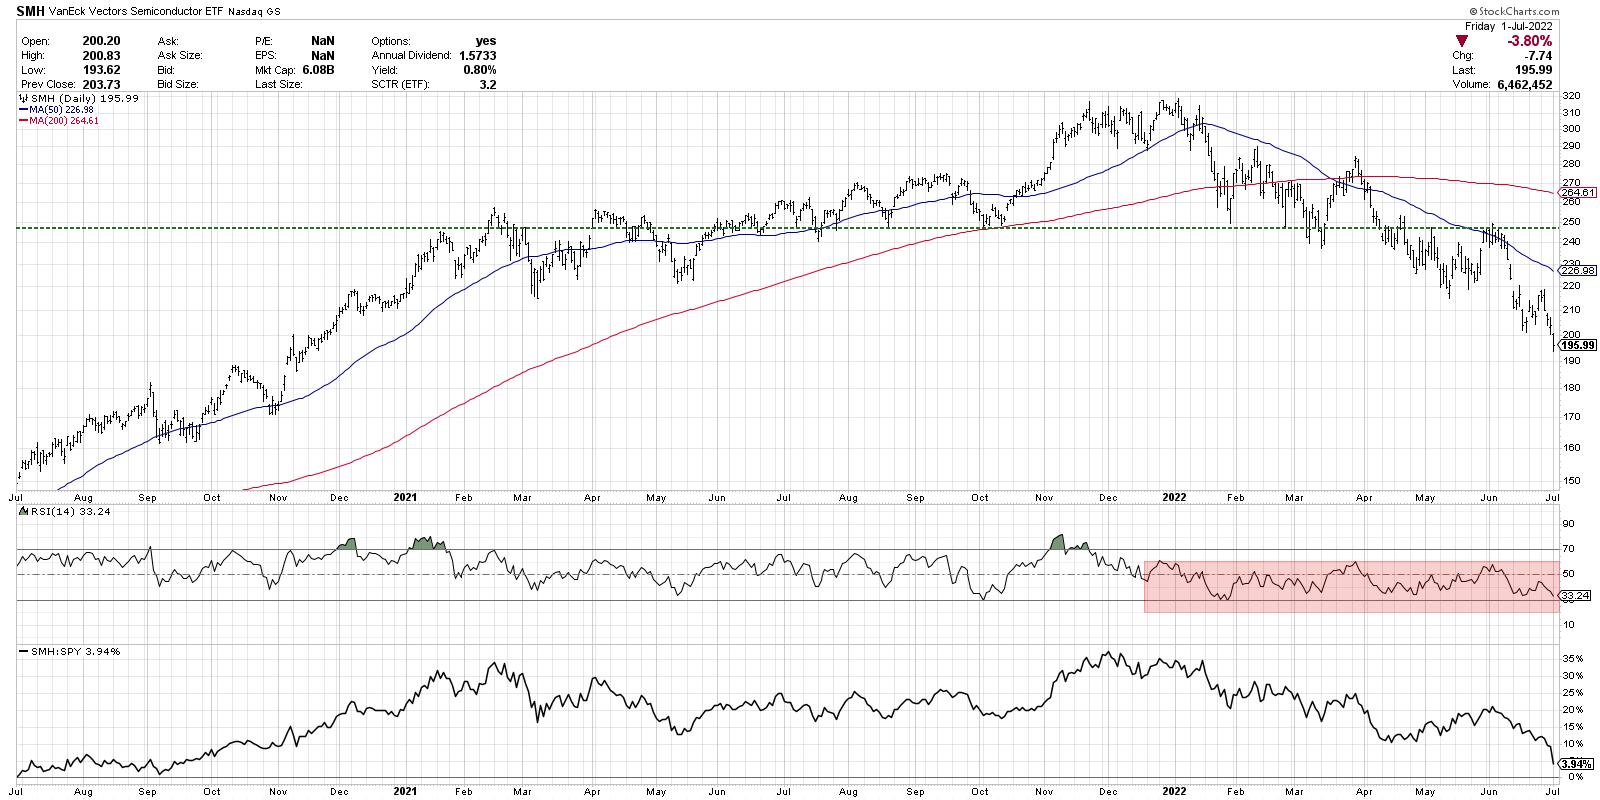
While the Nasdaq 100 index made a slightly lower high in January, the semiconductor ETF (SMH) actually made a higher high in early January. That ended up being the peak for 2022 thus far, as the SMH has achieved a new low every month. This past week saw the semiconductor group drop leading into the long holiday weekend, while most stocks finished the day in the green.
2022 has been marked by support levels being established and then broken, indicating a persistent downtrend of price weakness. The chart of semis tells the story beautifully, with a resistance level around $250 that was actually first confirmed in early 2021. The SMH bumped up to that $250 level a number of times until it was finally eclipsed in June 2021. This price level then became support (a key component of the technical toolkit) with subsequent retests in August and October. This level was finally violated to the downside in April, followed by a number of brief rallies to test $250 from below.
Over the last four weeks, semiconductors have shown renewed downside strength as the SMH has now moved below $200. Note the bearish range of the RSI, which has failed to move back above the 60 level on short-term rallies. This is a classic indication of a bear market phase, with weak momentum showing that sellers are very much still in control.
Finally, we see the relative strength, which is in a confirmed downtrend. Along with most of the growth-oriented sectors and groups, semiconductors are underperforming the broader equity market indexes.
But what about individual semiconductor stocks? Are they telling us anything different? Well, not only does Nvidia Corp (NVDA) mirror what we've discussed thus far, but a Fibonacci analysis seems to confirm the bearish thesis.
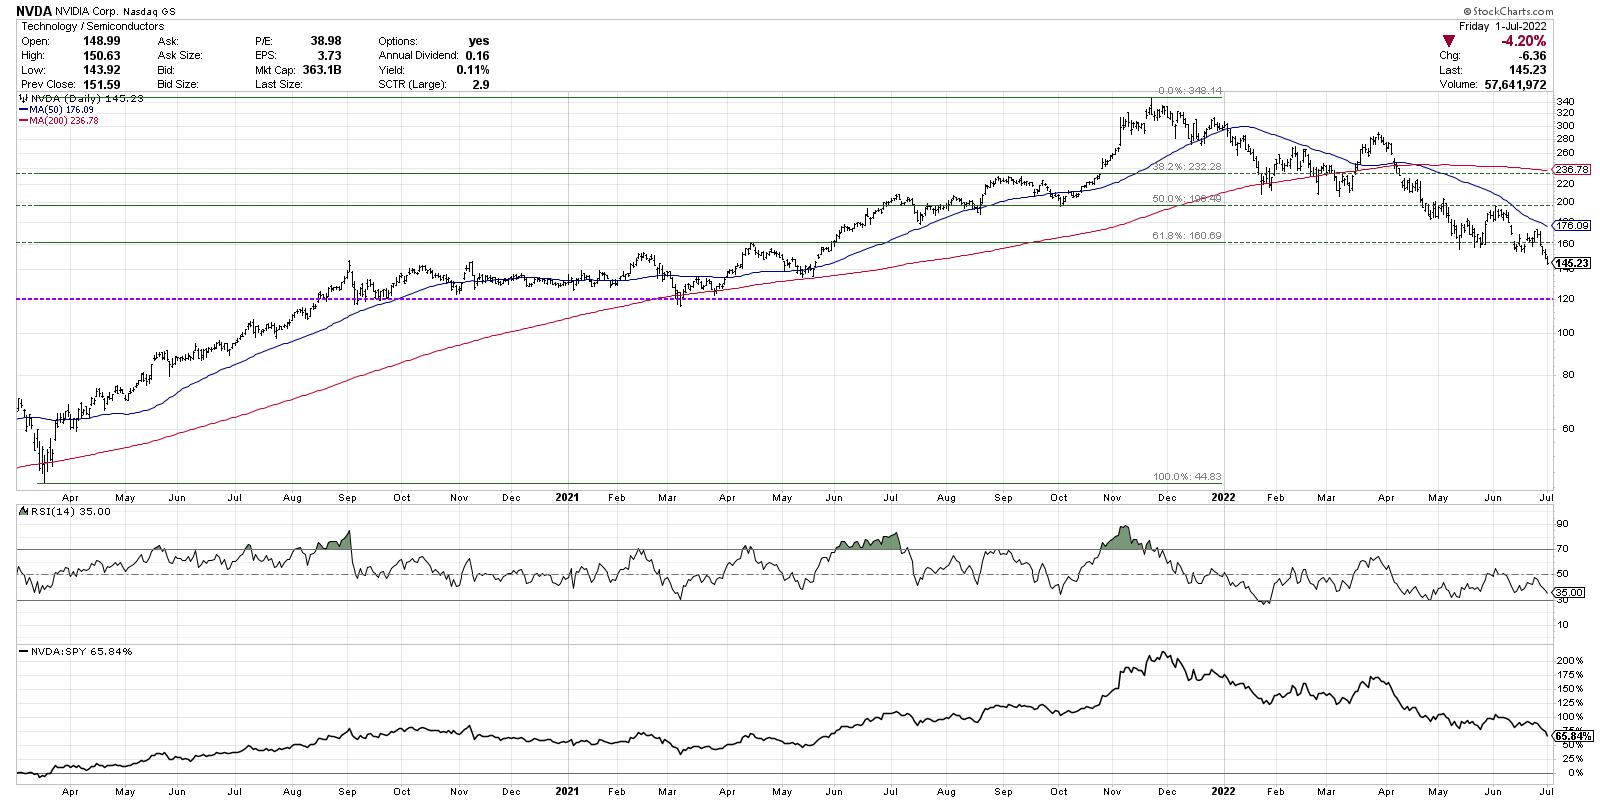
If we use the March 2020 low and November 2021 high, then $232 represents a 38.2% retracement off the all-time high. NVDA made a number of attempts to break below this level, yet, in each instance, it was able to bounce higher. This finally failed in April as the stock moved on to the 50% level.
The stock broke down through the 50% level (around $200) and retested that level from below two times. This level also served as price support back in October 2021. So a failure at $200 was another negative confirmation.
Nvidia popped up off the $160 level in May and early June, which represented a 61.8% retracement of the previous bull cycle. This week, NVDA finally broke down through this final level of Fibonacci support. In the short-term, the next potential support range would be around $120, based on the low in 2020 and 2021. Below that? All the way to the March 2020 low around $45.
Semiconductors are a struggling group in a struggling sector. It's hard to imagine that our growth-driven benchmarks would be able to mount any meaningful participation from a bellwether group like semis. As long the SMH continues to make new lows, the chance of a bull market recovery remains quite low!
RR#6,
Dave
P.S. Ready to upgrade your investment process? Check out my YouTube channel!
David Keller, CMT
Chief Market Strategist
StockCharts.com
Disclaimer: This blog is for educational purposes only and should not be construed as financial advice. The ideas and strategies should never be used without first assessing your own personal and financial situation, or without consulting a financial professional.
The author does not have a position in mentioned securities at the time of publication. Any opinions expressed herein are solely those of the author, and do not in any way represent the views or opinions of any other person or entity.


