Friday's sudden 3-4% drop felt like a wake-up call of sorts. At least it did for me, as I remained bearish through much of the recent rally phase. How could the market rally given all the macro headwinds -- inflationary pressures, higher interest rates, a hawkish Fed?
Tony Dwyer explained it well on my show The Final Bar this week, talking about the opposing forces described by two popular market maxims: "Don't Fight the Fed" and "Don't Fight the Tape".
The Fed governors, as summarized on Friday with Powell's Jackson Hole press conference, have made it clear that Quantitative Tightening is designed to have a very real impact on inflation. And if it impacts inflation, it will certainly impact risk assets. On the other hand, the market has just been rallying, led by growth stocks. I've noted how the rotation from severe bearish conditions to severely bullish conditions in a short time frame tells me to expect further downside, even I was surprised by the severity of the drawdown to end this volatile week.
So either a) bulls are hysterically avoiding clear macro headwinds to the bullish thesis for stocks, b) bears are hysterically ignoring the very clear signals that demand is outweighing supply for stocks, or c) the markets will rotate between two extremes to cause us all to feel a little hysterical.
I would probably vote c), and here's why.
I have spoken to many knowledgeable and experienced technical analysts and strategists in recent weeks, some of whom are fully convinced of the bullish thesis and others who are equally as sure that the downtrend is just beginning. I choose to focus on the evidence, and here are three charts I'm watching to help me minimize the hysteria and focus on price.
First, we have the daily S&P 500 chart with a focus on Fibonacci relationships.
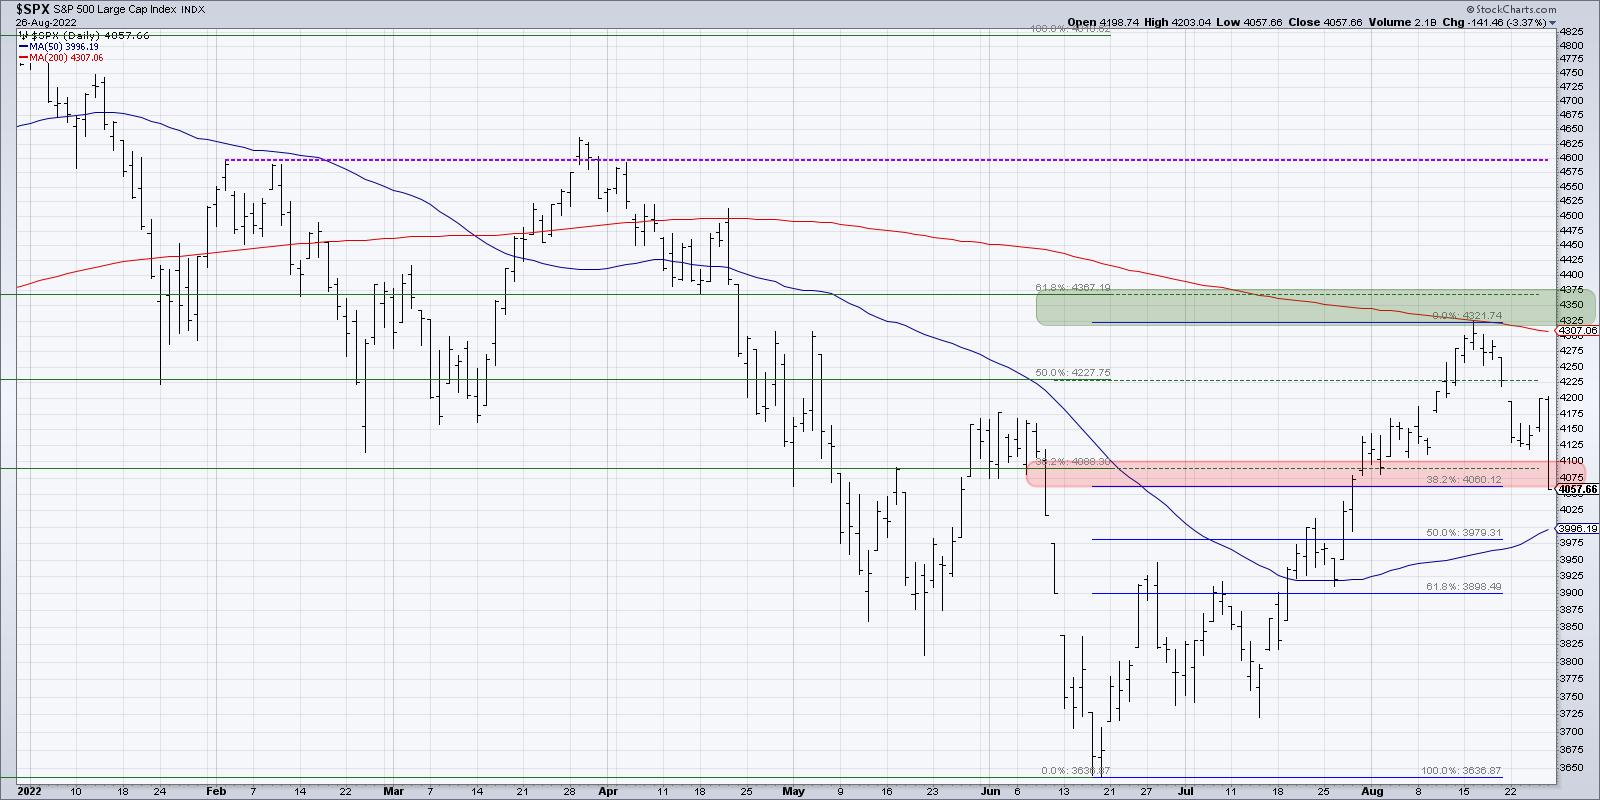
When the markets get crazier, my charts tend to get noisier, with lots of trendlines and annotations to capture my thinking as the price progresses forward. I cleaned up my SPX chart this week to focus on some key Fibonacci retracement levels.
If we start with the 2022 price range, from the January high to the June low, we end up with a 38.2% level around 4090 and a 61.8% level around 4370. The green-shaded area on the chart is from that 61.8% retracement level to the August high around 4320. If we use the June low and the August high as the framework, we get to a 38.2% retracement level around 4060, which is the bottom of the red-shaded area on our chart. The top of that red-shaded area is from the 38.2% level described above, around 4090.
You'll note that with today's selloff, the S&P 500 closed just below the bottom of the red-shaded area. That means next Monday and Tuesday could be key to determining whether we get a downside follow-through with lower prices (indicating a high probability of a retest of the 2022 lows) or a bounce back to the upside (in which case, this red/green framework remains super relevant!).
If we do follow-through to the downside, which I believe we will, then the next downside objective could be the 61.8% level around 3900.
My second chart is the VIX.
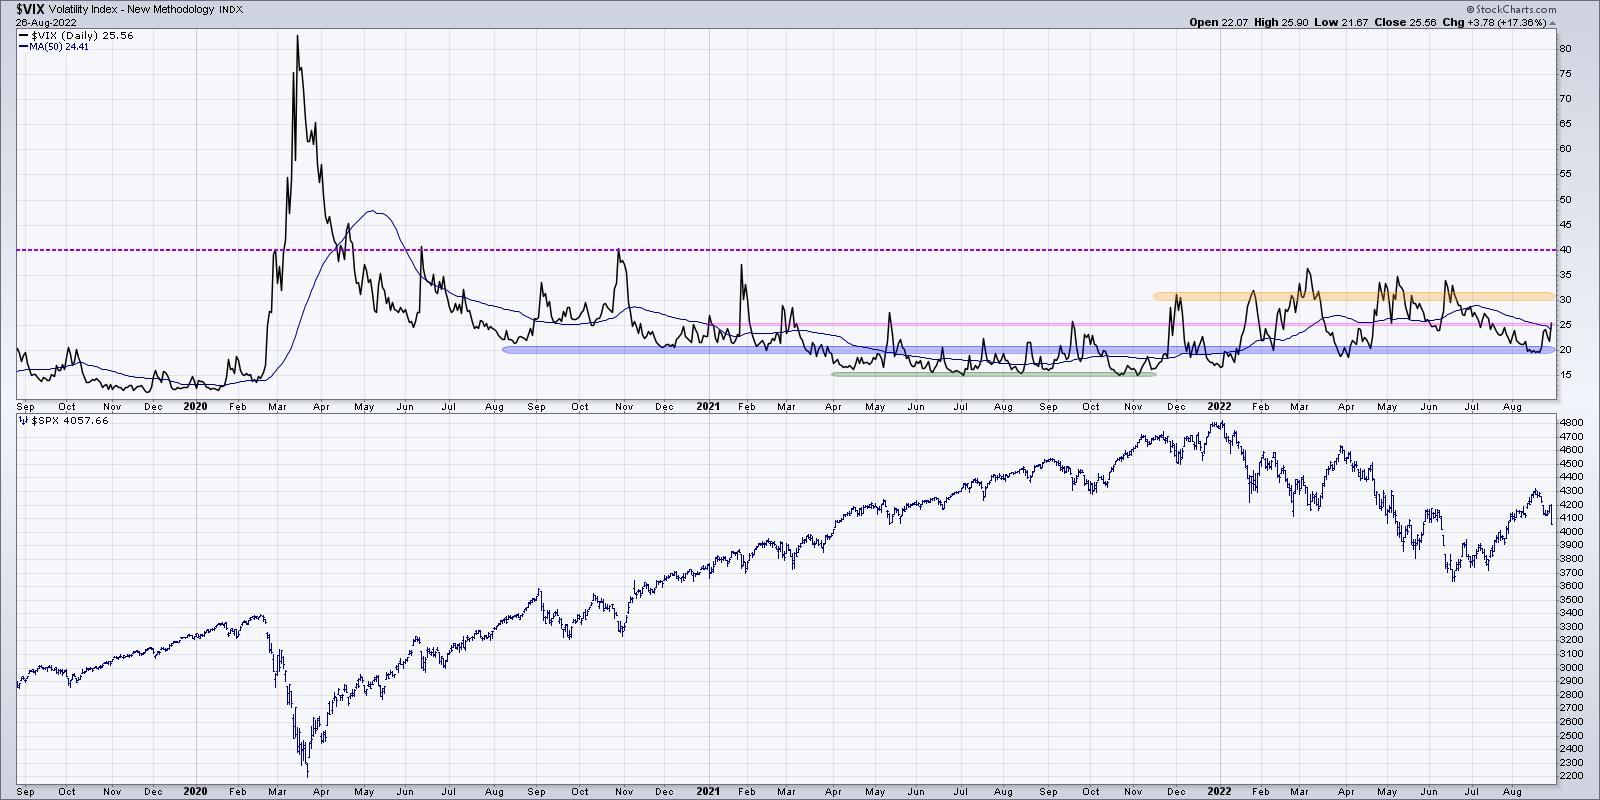
I've shared why the VIX is such an important measure of market sentiment, and this month we've seen the indicator again prove to be a vital indicator of price extremes.
For most of 2022, the VIX has ranged between 20 on the lower end and 30-35 on the upper end. The most recent stock rally pushed the VIX back down to its lowest levels for the year. As expected, volatility has now risen once again, as prices pulled back from key resistance levels. The bull case for stocks would involve the VIX most likely getting below 20 and staying there. At this point, that is not what we're seeing.
Finally, we can use Bullish Percent Indexes to measure market breadth.
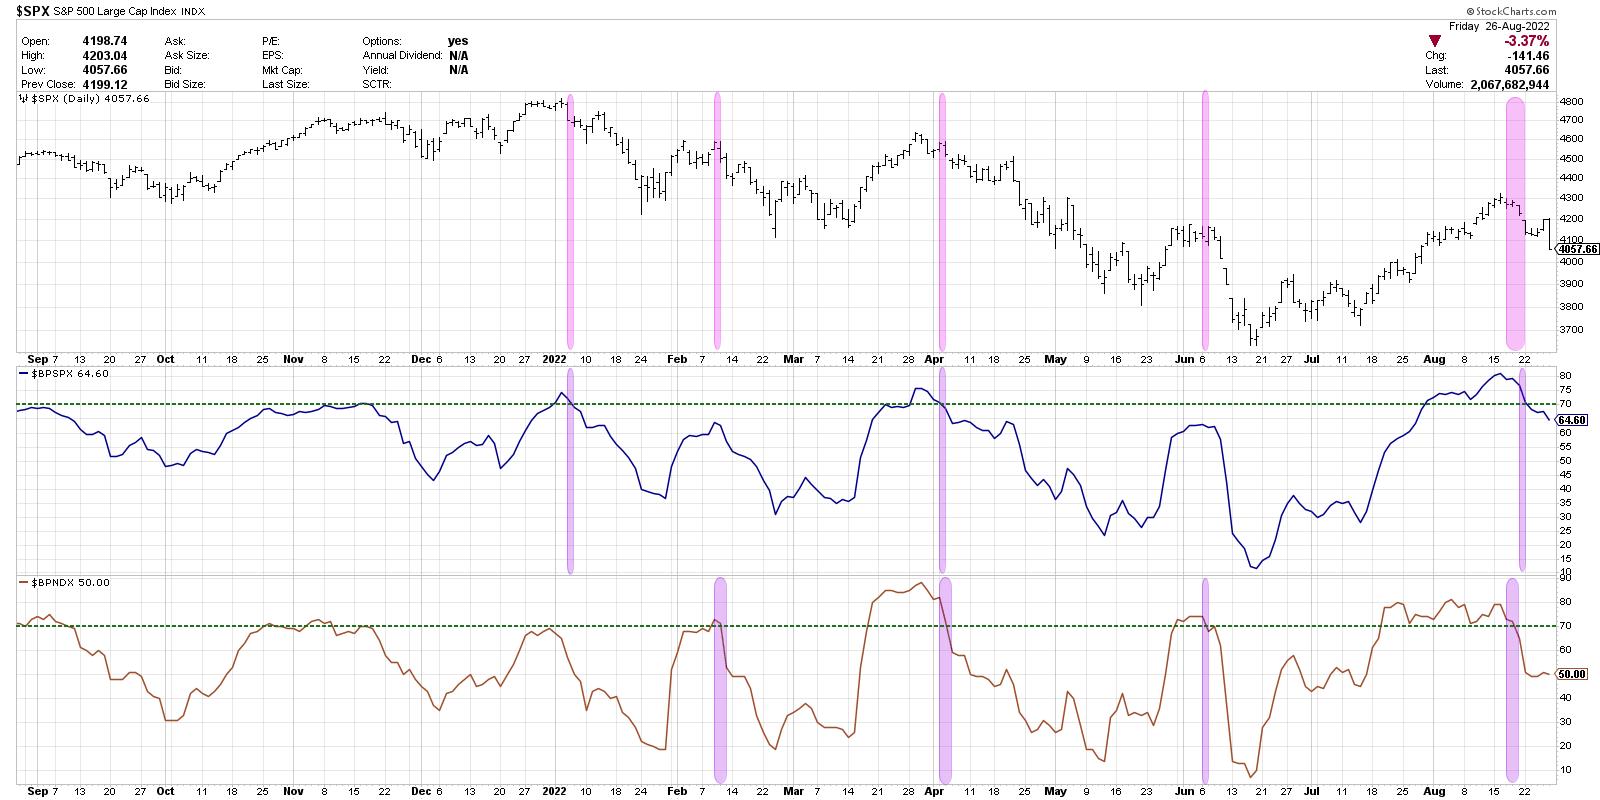
Here, we are illustrating the S&P 500 daily chart along with the Bullish Percent Index for the S&P 500 and the Nasdaq 100 indexes. I've indicated with purple bars any time either indicator has gone from above 70 to back below. On the SPX price bars, I'm highlighting any time either of the BPI charts have dipped back below 70. Basically, you can see that every major top so far in 2022 has been marked by one or both of these breadth indicators turning from confirmed bullish (over 70) to back below that key threshold.
This final chart tells me to expect further downside, because if we would rally next week, then that would be the first time in 2022 for such a pattern to have emerged.
In my webcast earlier this week, we discussed how the seasonal trends in September are not ideal for technology stocks. Given the way the week ended with a whimper, we may be seeing just the beginning of that seasonal weakness playing out in 2022.
RR#6,
Dave
P.S. Ready to upgrade your investment process? Check out my YouTube channel!
David Keller, CMT
Chief Market Strategist
StockCharts.com
Disclaimer: This blog is for educational purposes only and should not be construed as financial advice. The ideas and strategies should never be used without first assessing your own personal and financial situation, or without consulting a financial professional.
The author does not have a position in mentioned securities at the time of publication. Any opinions expressed herein are solely those of the author, and do not in any way represent the views or opinions of any other person or entity.