When someone sends me a ticker to review, the first thing I do is bring up my standard two-year daily chart on StockCharts. And the very first question I ask myself is always the same: is this chart in an accumulation phase or a distribution phase?
Now that is a somewhat subjective question to be sure, but the technical toolkit provides many ways to quantify trends and measure trend strength. For me, "accumulation" suggests that buyers are pushing prices higher, thus the stock is in an uptrend. And "distribution" means essentially an absence of buyers, meaning the price trends lower over time.
The StockCharts SCTR rankings are based on a simplistic price momentum model. Basically, the stronger the trend, as defined on three different time frames, the higher the SCTR. As I review the top ten large cap stocks based on their SCTR rankings, I'm struck by the consistent uptrends of stocks very much in an accumulation phase.
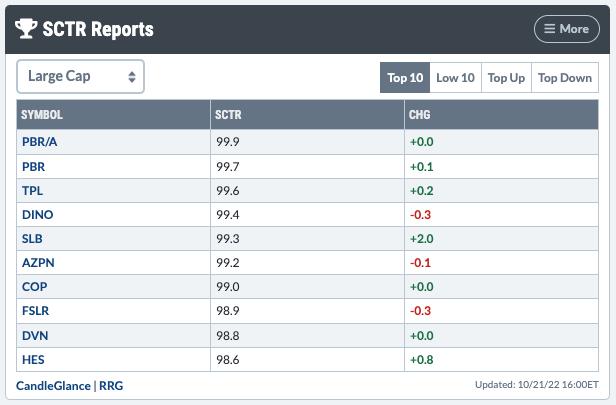
This is a very energy-heavy list of stocks, which is not surprising given the strength this sector has demonstrated in 2022. As a matter of fact, the XLE has outperformed the S&P 500 index by over 67% year-to-date! So while this particular list of names is skewed to one sector, you'll find with a regular review that the tickers will change but the strength in the charts is universal.
Here are the top-ten ranked large cap stocks based on their SCTR scores, along with comments for each. Note three consistent features: higher highs and higher lows, strong momentum characteristics and improving relative strength!
1. Petrobras (PBR/A)

2. Petrobras (PBR)
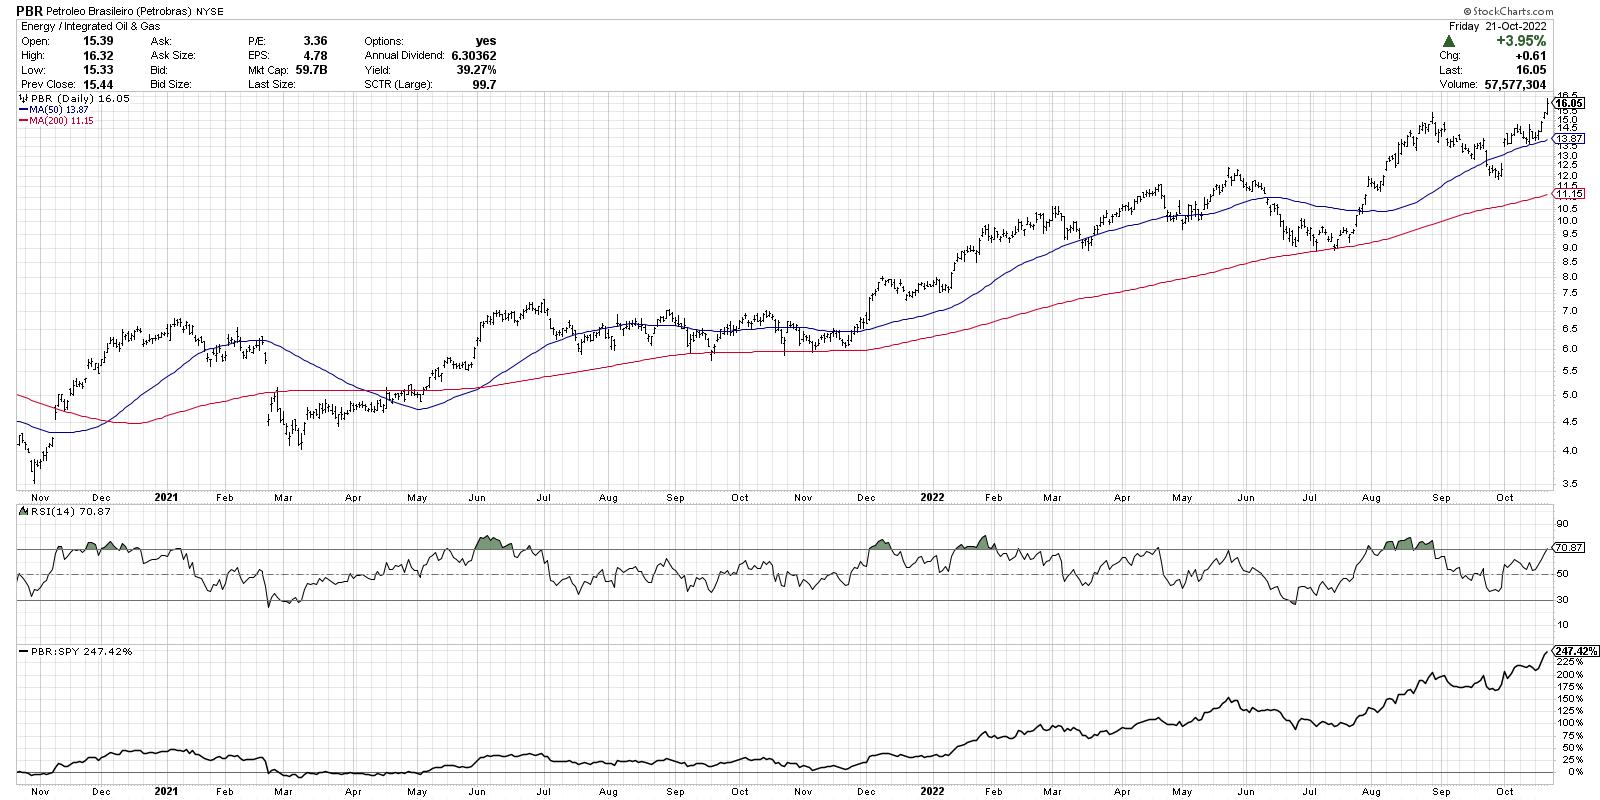
These first two are different share classes of the same Brazilian oil company, Petrobras. It's hard to imagine a chart like this exists in a year when the major equity averages are in consistent downtrends!
Note the recent breakout to new highs after a pullback to the 50-day moving average, which is a classic bullish pattern.
3. Texas Pacific Land Trust (TPL)
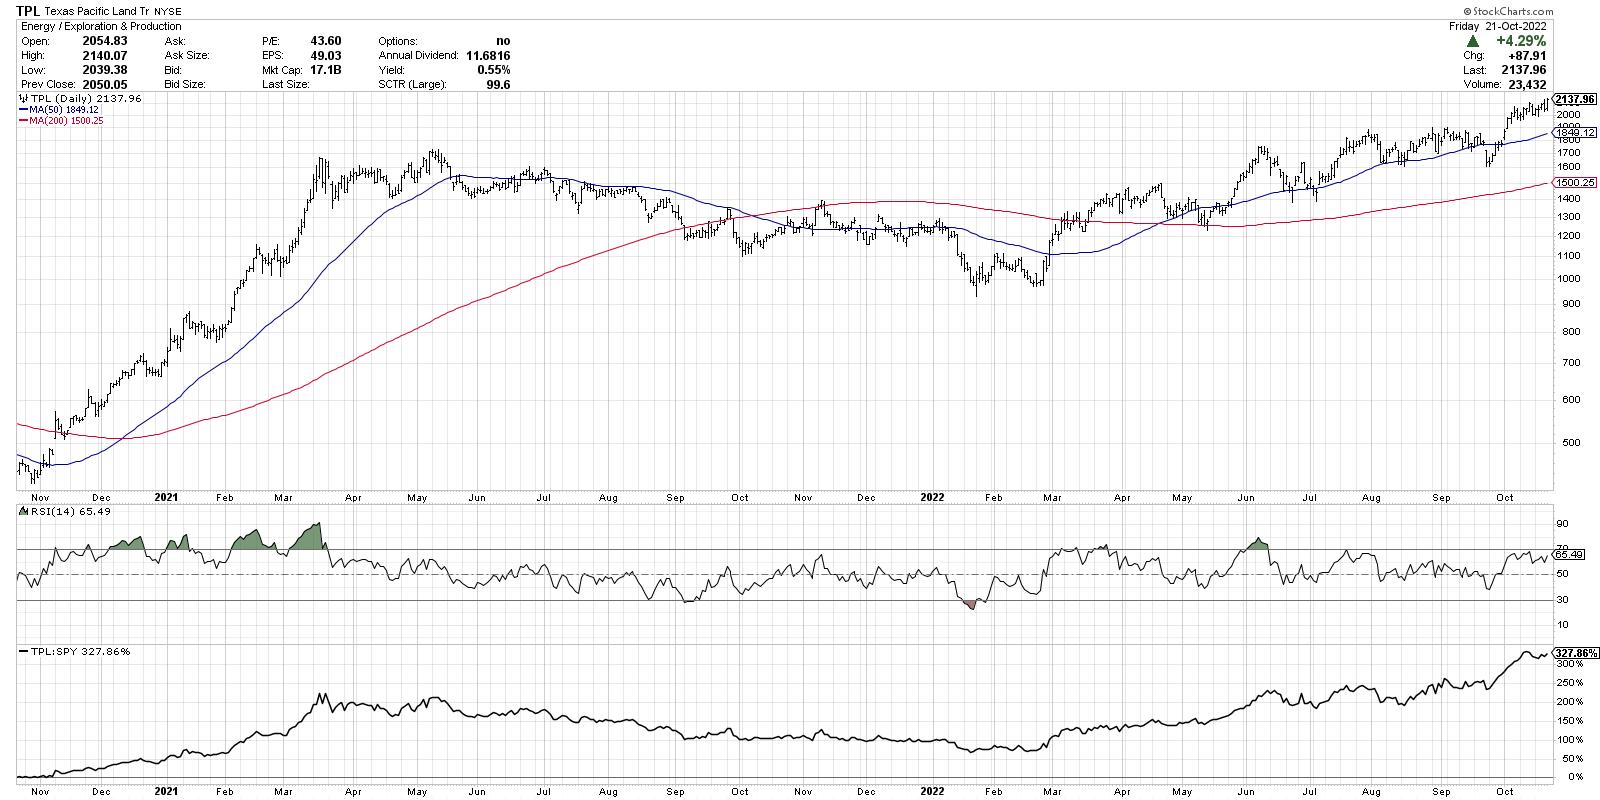
A rare name that has doubled since January, TPL just broke above the $2000 level for a new all-time high. Notice how the RSI has remained above 40 on recent pullbacks, which is common in bull phases.
4. HF Sinclair Corporation (DINO)
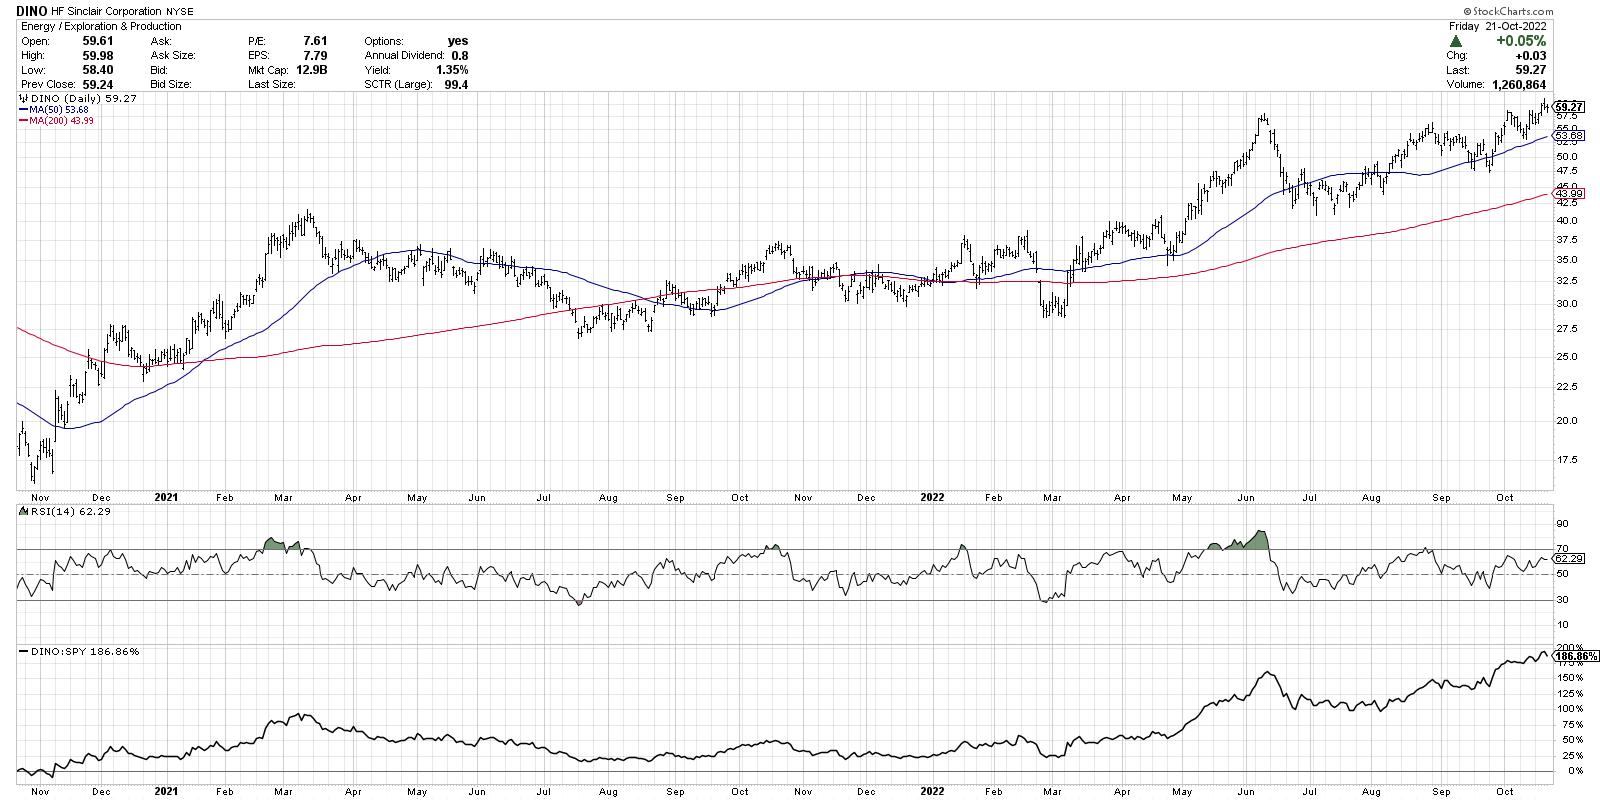
Now this one has a cup-and-handle appearance to it, with a rounded consolidation phase from the June peak into late August, followed by a shallower pullback in September. The recent break to new highs completes the pattern and suggests further upside potential.
5. Schlumberger (SLB)
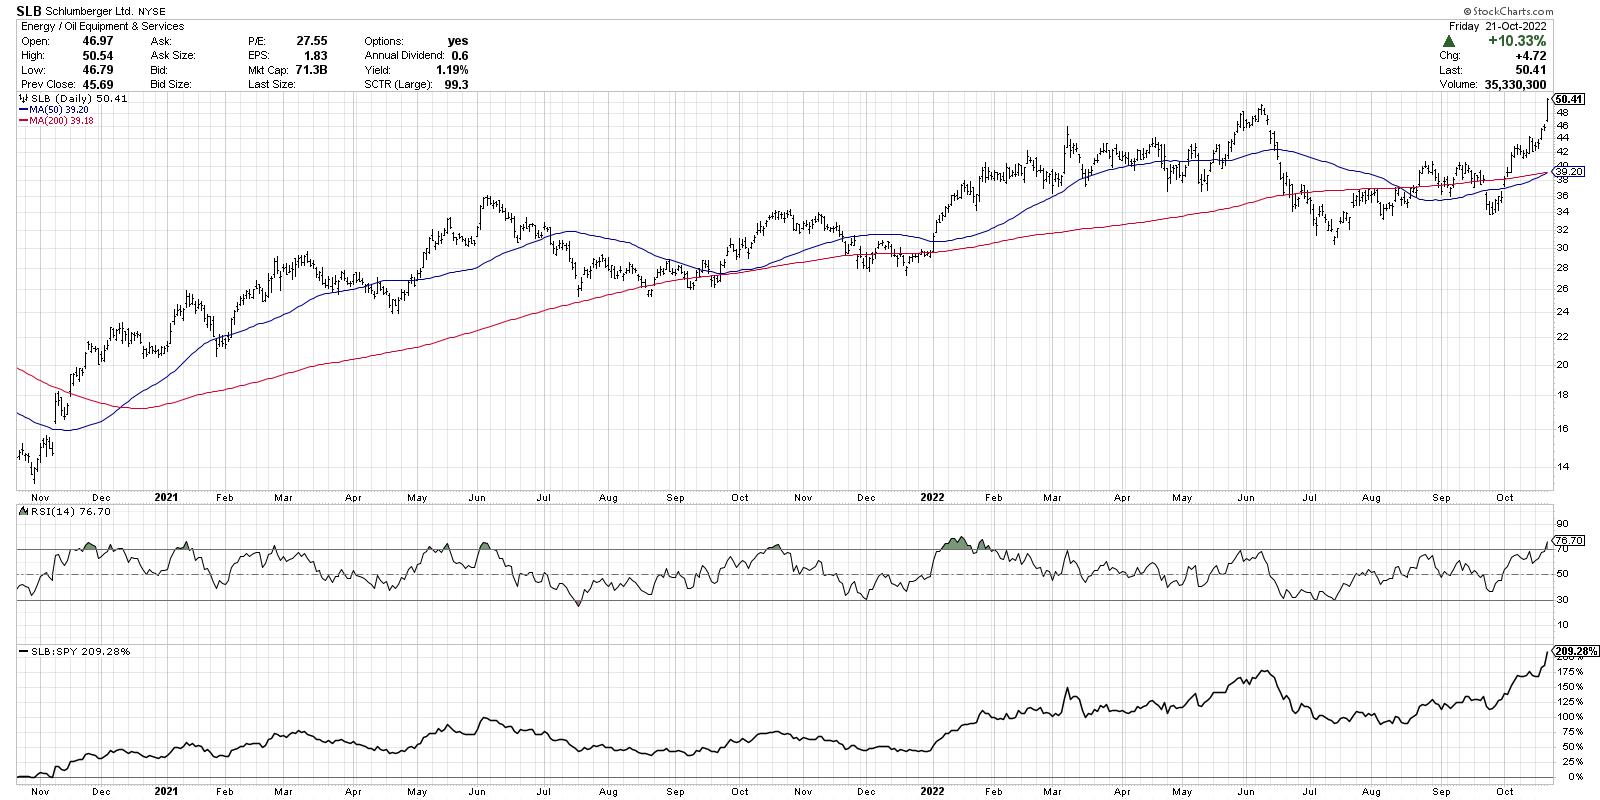
SLB pulled back with the rest of energy in June, but the higher low in October set the stage for a successful retest of the June high. The stock is now overbought with an RSI over 70, but that is not always a bad thing! Check out the RSI in January.
6. Aspen Technology (AZPN)
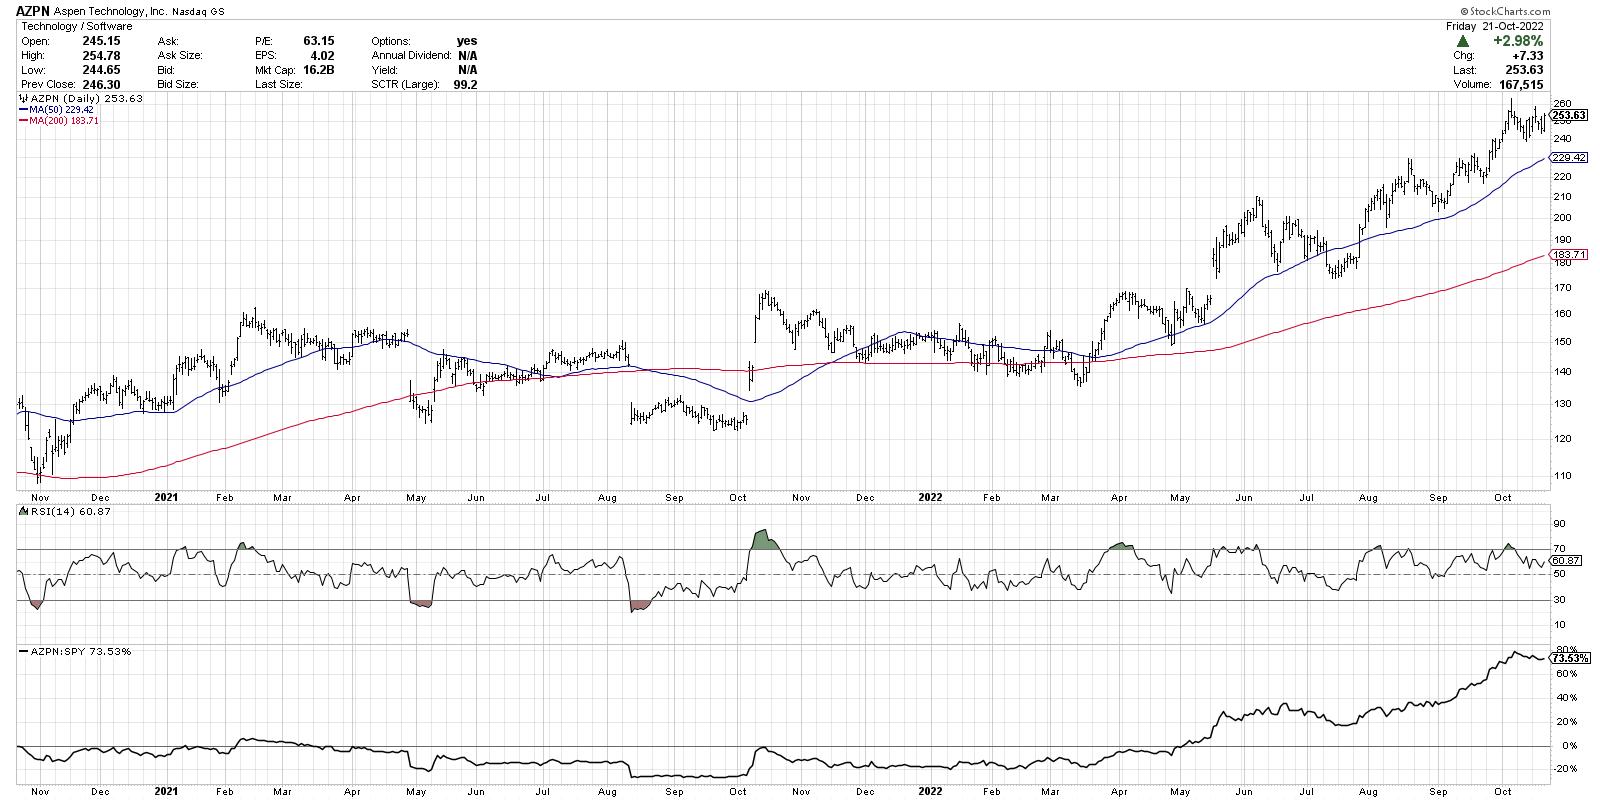
What? A technology stock actually made it into the top ten?!? AZPN has been quite an outlier in its sector, up 67% year-to-date while the XLK is down about 28%. Here, we find a very consistent uptrend of higher highs and higher lows. When the price is above two upward-sloping moving averages, the trend is strong.
7. ConocoPhillips (COP)
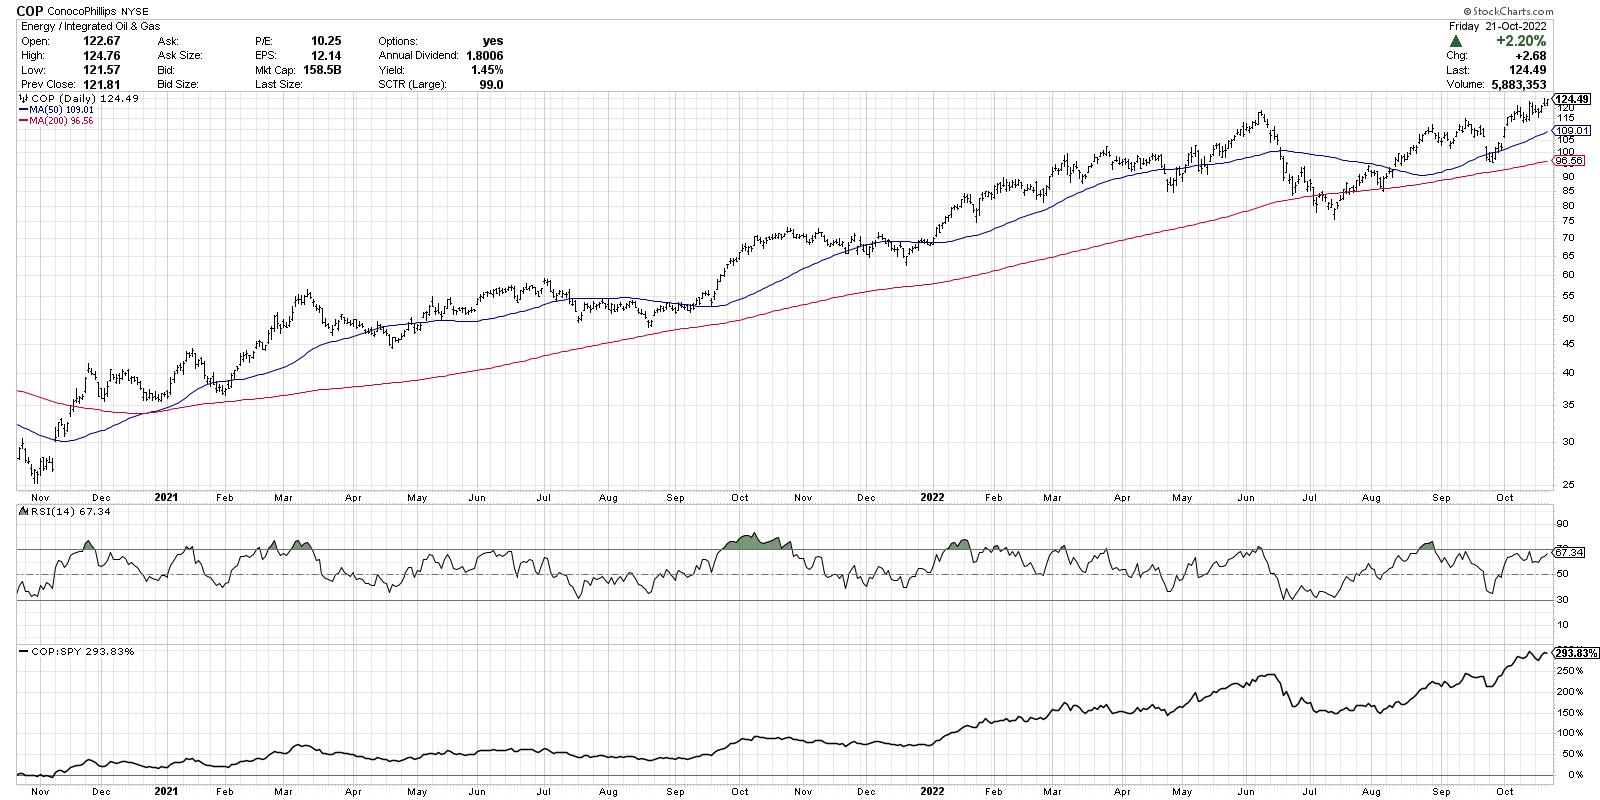
COP has an even better cup-and-handle pattern than DINO, with a clearly defined "rim" to the cup and a valid breakout above resistance in early October. Somewhat weaker momentum since the overbought conditions in August, which may be something to watch.
8. First Solar (FSLR)
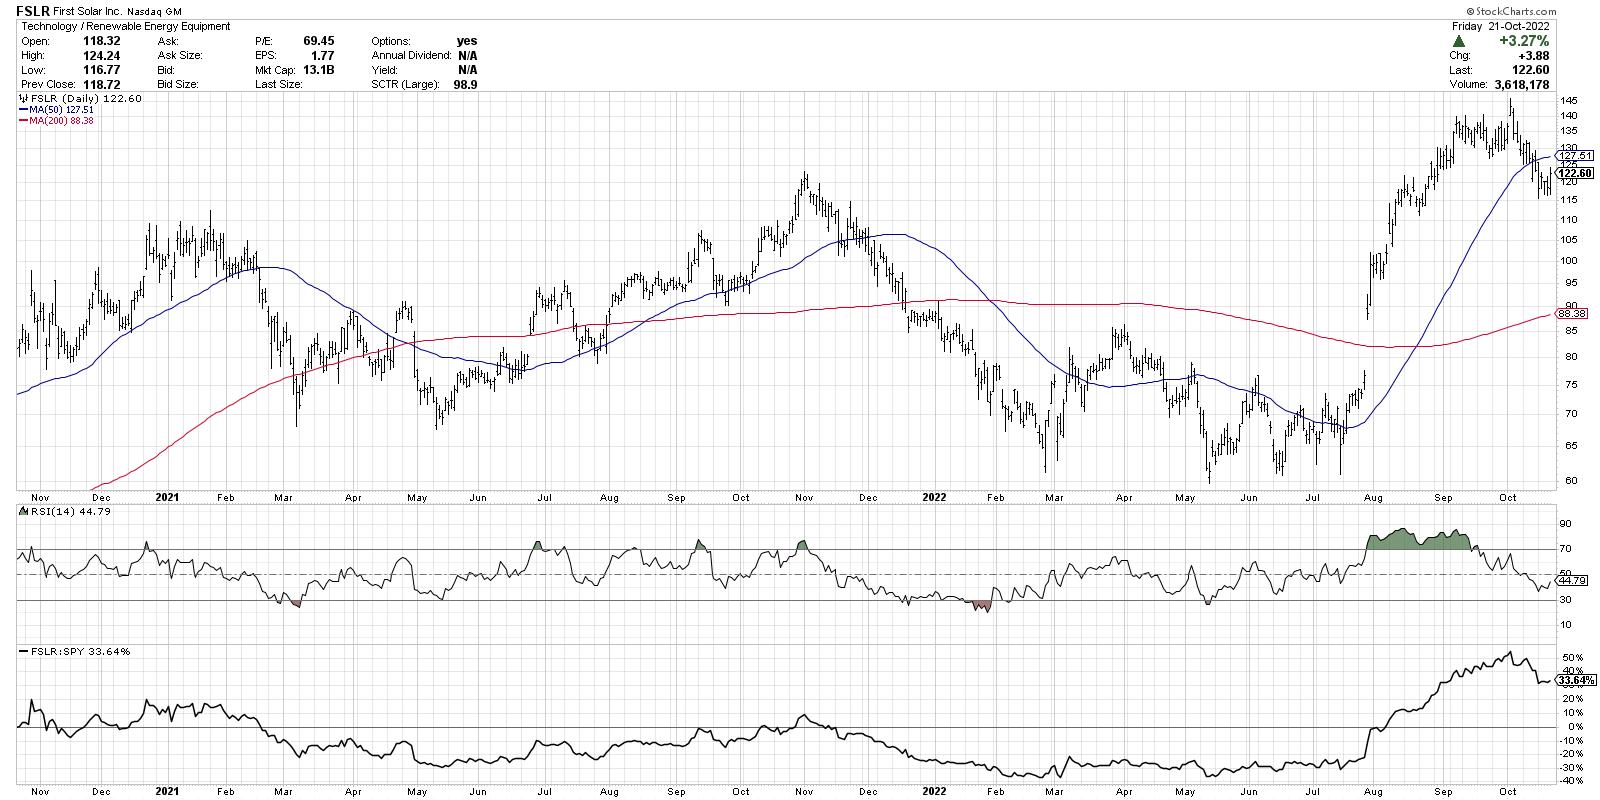
Now we go from "old energy" to "new energy" with a jump to the solar stocks. This is an intriguing chart for many reasons. Look how FSLR tested price support around 60-65 numerous times, before gapping higher in July and never looking back.
The price broke above the 2021 high in late August and has now pulled back to the breakout level around $120. Can FSLR hold this key support level?
9. Devon Energy (DVN)
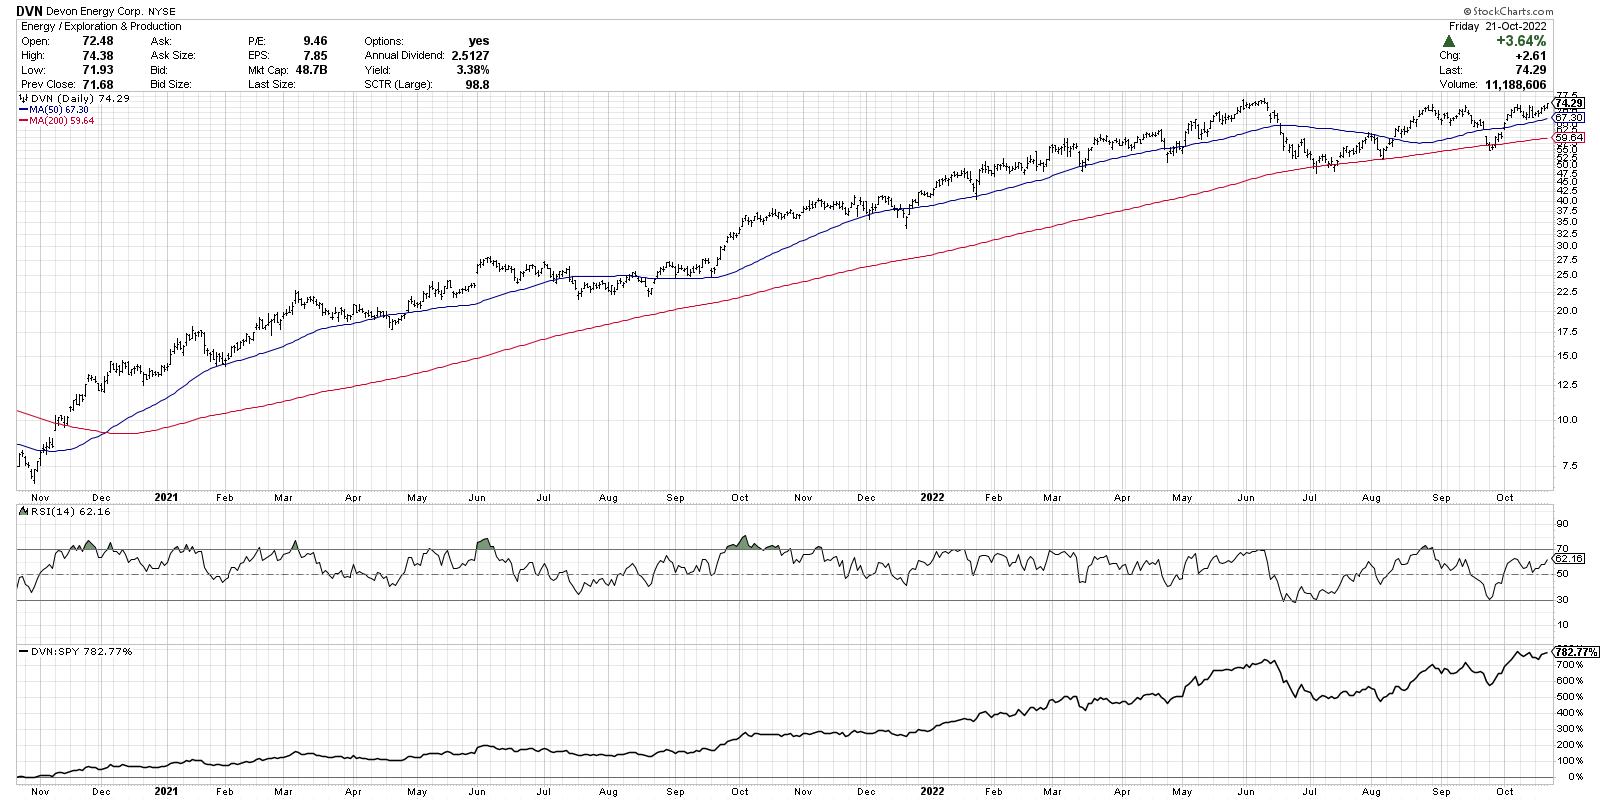
DVN has been a favorite name in 2022, particularly in the first half of the year, when it was often in the SCTR top ten. Along with the rest of the energy space, we're seeing renewed upside pressure and a retest of all-time highs. Does this trend continue to much higher highs? I would suspect the answer is most likely yes.
10. Hess Corp (HES)
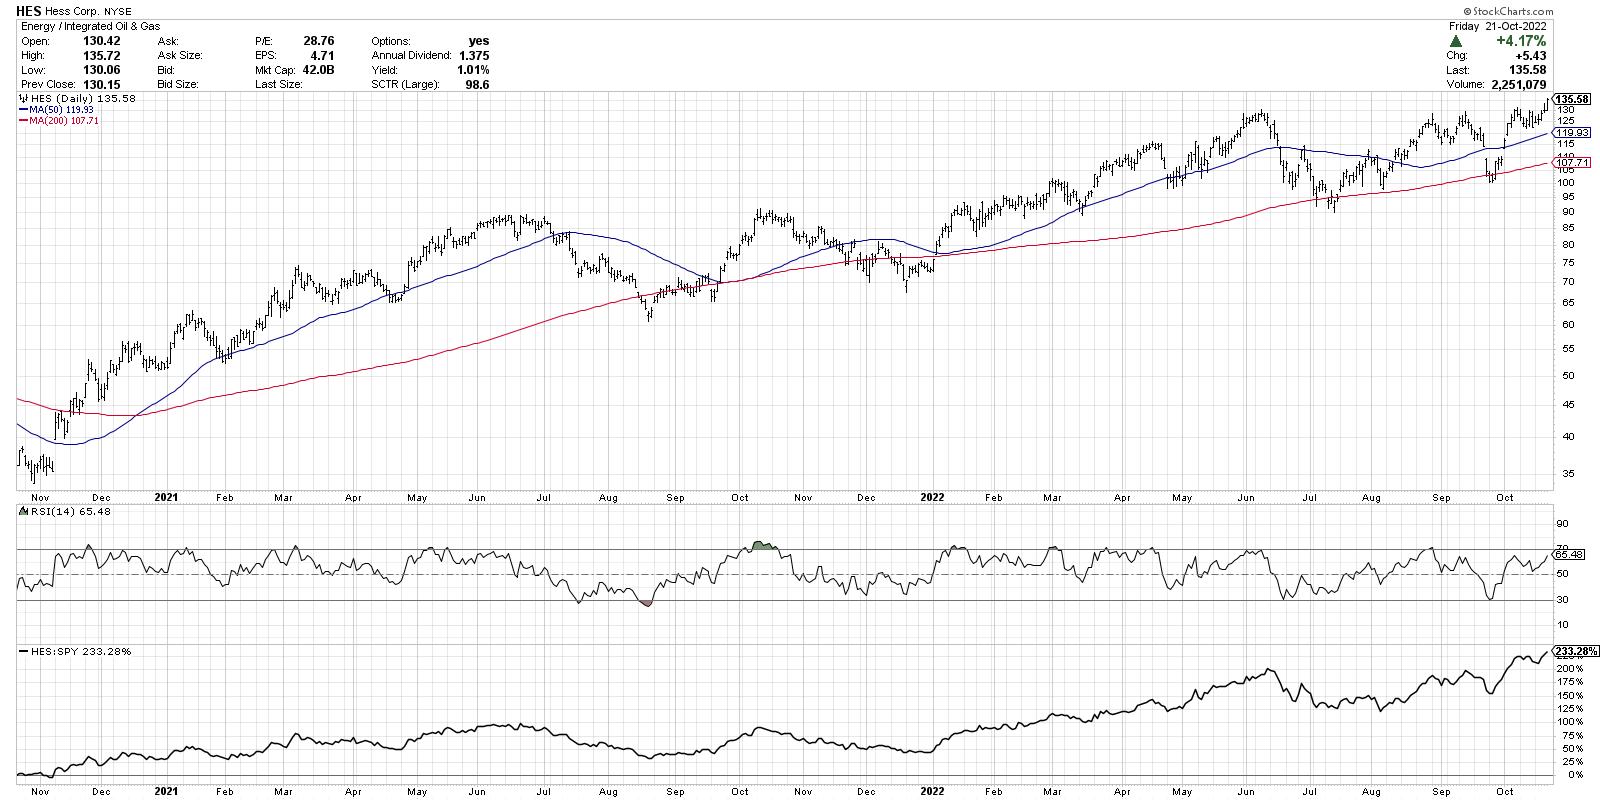
And we may have saved the best for last. HES has been in a basing pattern for the last four months and, just this week, made a decisive move above the $130 level. And the relative strength shows that this has been a consistent long-term outperformer.
So what is consistent with all of these charts? They are in the accumulation phase. They are showing evidence that buyers are pushing prices higher as resistance levels are met and eclipsed.
While this round is dominated by energy stocks, that is certainly not always the case. But if you regularly review the top-ranked SCTR stocks, you will find that, regardless of the broader market environment, some stocks somewhere will be in the accumulation phase.
As Paul Montgomery once said, "The most bullish thing the market can do is go up."
One more thing... My latest YouTube video answers a recent question, "Can you discuss the role of time in the formation of technical patterns?" Check it out:
RR#6,
Dave
P.S. Ready to upgrade your investment process? Check out my YouTube channel!
David Keller, CMT
Chief Market Strategist
StockCharts.com
Disclaimer: This blog is for educational purposes only and should not be construed as financial advice. The ideas and strategies should never be used without first assessing your own personal and financial situation, or without consulting a financial professional.
The author does not have a position in mentioned securities at the time of publication. Any opinions expressed herein are solely those of the author, and do not in any way represent the views or opinions of any other person or entity.


