I was reviewing my weekly ChartList reports this afternoon and noticed this one, showing the top performing sectors for the week.
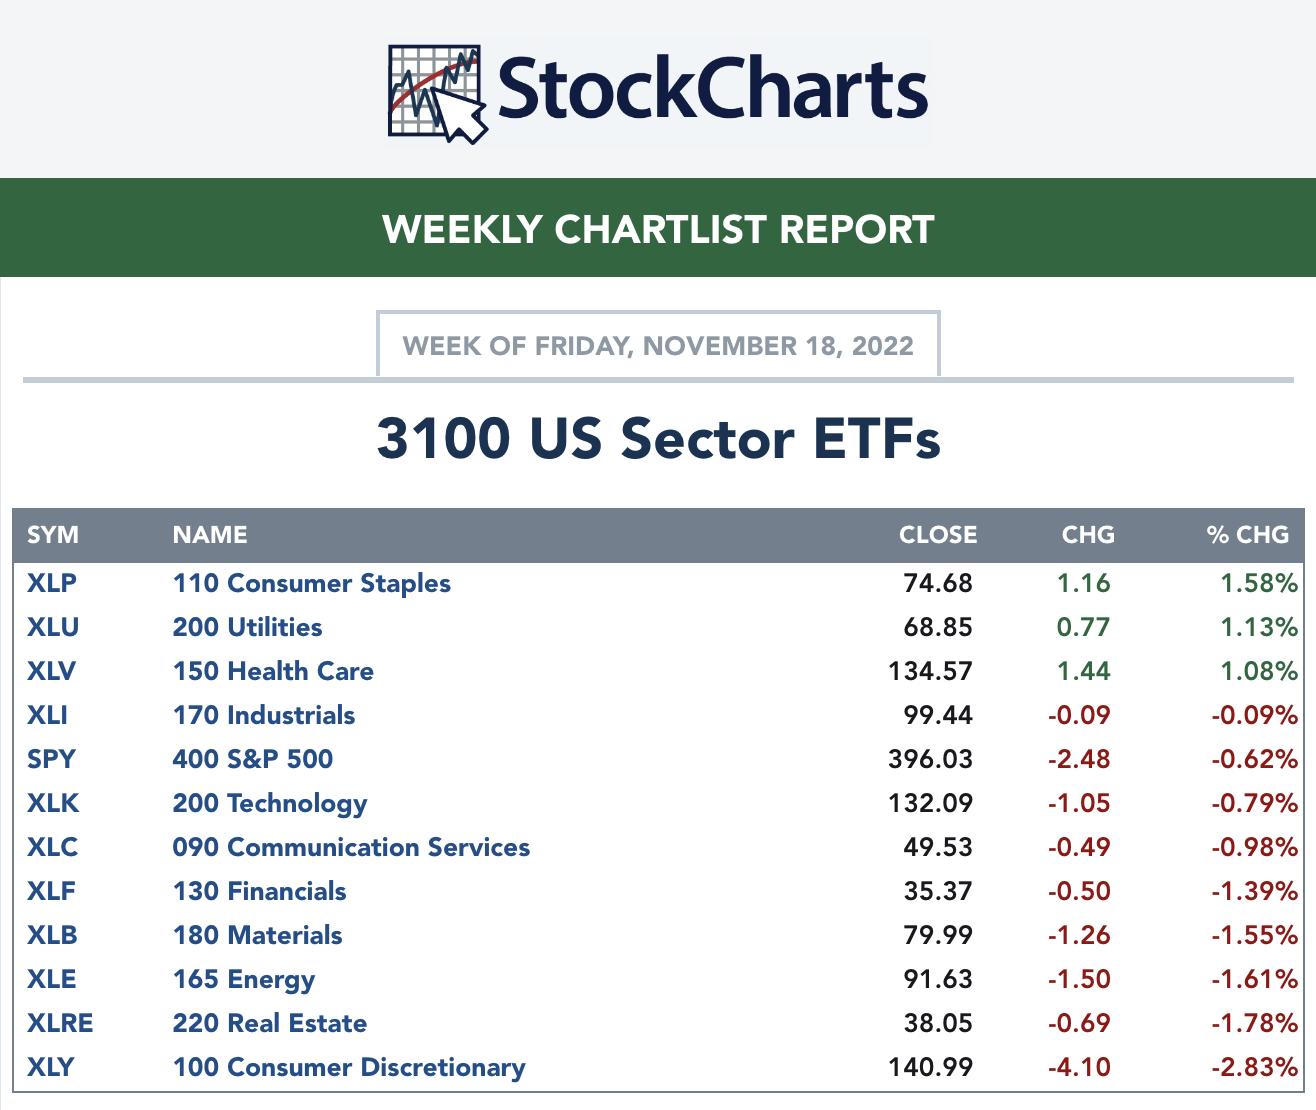
Only three of the 11 S&P 500 sectors were up on the week: Consumer Staples, Utilities and Health Care. Not exactly an offensive powerhouse on the top of the leader list, right?
But seeing Consumer Staples in the top spot led me to review my favorite chart to track: Offense vs. Defense for the equity markets.

This chart shows the relative performance of offense (Consumer Discretionary) vs. defense (Consumer Staples) in the consumer space. Basically, this is comparing "things people want" vs. "things people need" and can be a great indication of overall risk appetite for equities.
The top panel is using the cap-weighted ETFs (XLY and XLP) while the bottom ratio includes the equal-weighted versions (RCD and RHS). I prefer the equal-weighted ratio, as the XLY is heavily skewed to just three stocks -- AMZN, TSLA and HD -- and I'd much rather get a broader sense of rotation in these sectors.
After both of these ratios made a new low in the 2nd quarter, they moved higher as the S&P 500 rallied in July and August. Notice how the cap-weighted version broke to a new swing high in August, while the equal-weighted version did not? This was a great bearish tell in my opinion, signifying that there wasn't enough expansion into Consumer Discretionary.
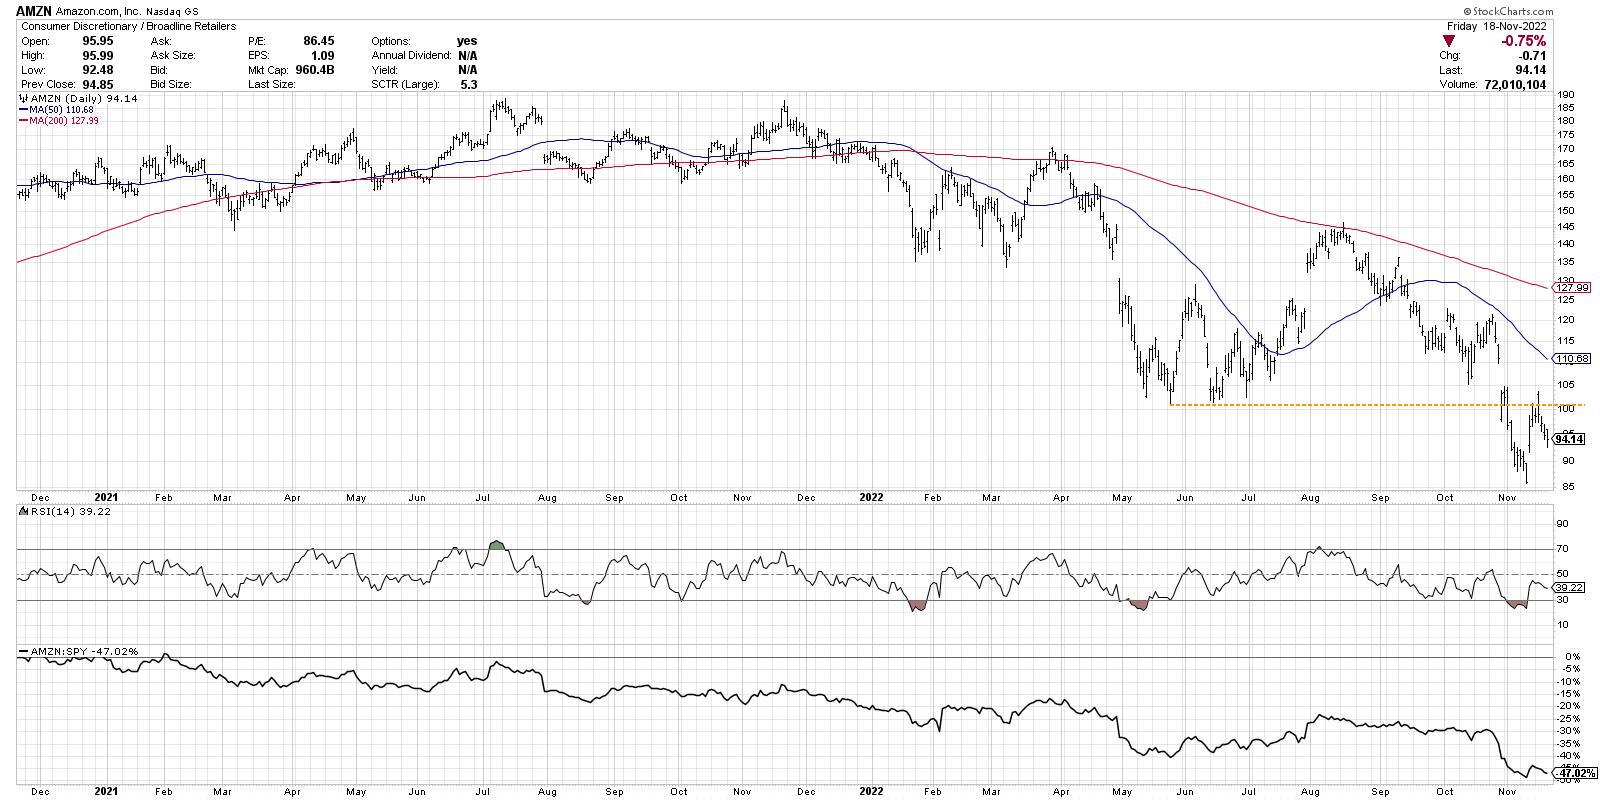
More recently, the cap-weighted version has been struggling, as mega-cap stocks AMZN and TSLA have been in a confirmed downtrend. Here, we see AMZN dropping once again retesting the recent breakdown below $100.
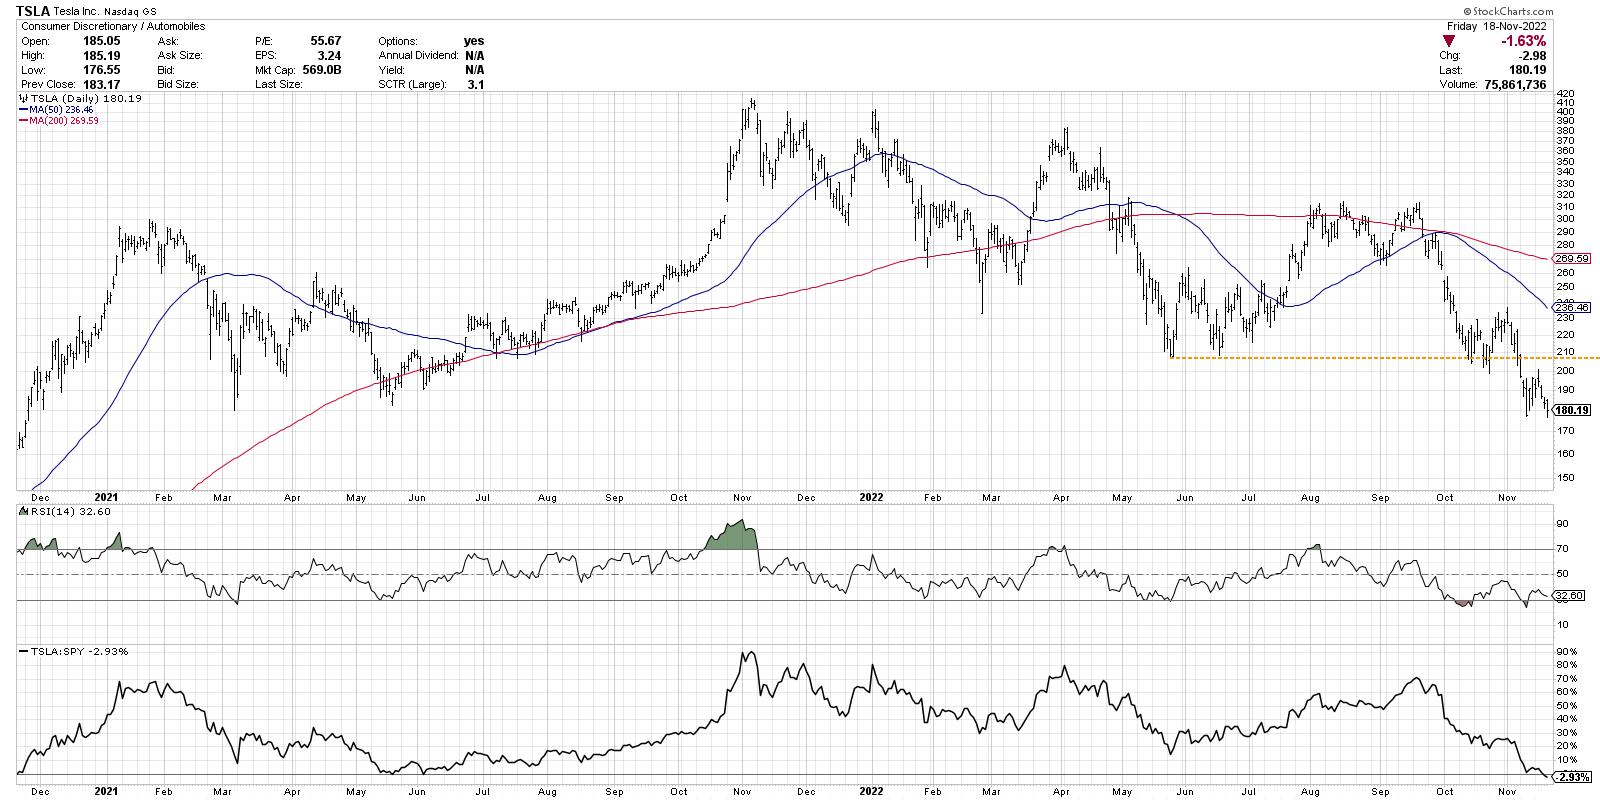
And here is TSLA, making a new 52-week low again this week.
As opposed to the cap-weighted version, the equal-weighted version of the offense-defense ratio recently tested its June high. In last weekend's report to my Market Misbehavior premium members, we noted that if this ratio were to break to a new swing high, that could indicate a broader advance for the S&P 500. Instead, this week saw the S&P 500 essentially tread water at -0.6%, while the equal-weighted offense vs. defense ratio pulled back from its previous resistance level.
As the S&P 500 tests its 200-day moving average, similar to what we saw back in August, I'm monitoring price and breadth measures to see if we build enough positive momentum to propel through the 200-day moving average, and perhaps reach to the August peak or even higher. But until Consumer Discretionary begins to outperform Consumer Staples once again, I'm skeptical of the upside possibilities for the major equity averages.
So what's next for the S&P 500? I see four potential future paths for this index, from the very bullish (SPX 4800) to the very bearish (SPX 3200). Which scenario do you see as most likely, and why? Check out the video and let me know in the comments!
RR#6,
Dave
P.S. Ready to upgrade your investment process? Check out my YouTube channel!
David Keller, CMT
Chief Market Strategist
StockCharts.com
Disclaimer: This blog is for educational purposes only and should not be construed as financial advice. The ideas and strategies should never be used without first assessing your own personal and financial situation, or without consulting a financial professional.
The author does not have a position in mentioned securities at the time of publication. Any opinions expressed herein are solely those of the author, and do not in any way represent the views or opinions of any other person or entity.


