I've now been hosting our closing bell show, The Final Bar, for over three years. It's been such a fascinating experience to use my daily show as a way to focus my own analytical process, and I truly believe that hosting a show like this has helped me navigate uncharted waters (pun intended) much more effectively than I would have otherwise.
Why We Wait for the Final Bar
We called the show "The Final Bar" for three main reasons. The first reason was that my experiences in music have taught me that the final bar, or the very end of the piece, can tell you a great deal about what has come before. And no matter what you remember from an entire piece of music, you always remember the final bar.
The second reason was that, when I taught technical analysis at the university level, I would always teach people to start at the most recent price, that is, the final bar. Start with today, then go to the left. Which support and resistance levels seem important? Those are the ones you should probably follow going forward.
"All large losses begin as small losses."
What sets successful investors apart from others? Their ability to manage risk, admit when they're wrong, recognize shifts in market dynamics, and take decisive action when the markets demand.
In our latest free webinar, I'll share best practices I've learned from successful investors on how to manage risk by maximizing gains and minimizing losses. Let's talk through some recent charts and review how technical analysis can help you survive to invest another day! Sign up HERE for this free event on Tuesday 12/13!
The final reason was from conversations with one of my mentors in the industry, Jeff Weiss. Jeff taught me to be a patient investor and to do so by waiting for the close. On a daily, weekly, or monthly chart, avoid drawing conclusions before the close of the bar is confirmed by the end of the current period.
So Friday's price action took me back to all of these lessons, as the S&P 500 Index ($SPX) and Nasdaq Composite ($COMPQ) took what appeared to be a choppy sideways session and turned it into a pattern of distribution.
 By waiting for the end of the week, and the end of Friday's session, you would have gotten a more complete sense of how this week ended up being a downside follow-through after last week's test of the 200-day moving average (MA).
So where does that leave the markets going into next week's Fed meeting?
The Dreaded Shooting Star Candlestick Pattern
Stocks like NVIDIA (NVDA) and Netflix (NFLX) had incredible runs since their lows earlier in the year. While NFLX hit its low for 2022 (year-to-date) back in May, NVDA did so in October. Both names have accelerated off their lows in recent weeks. But a review of the candle charts on Friday shows that both of them dropped a shooting star pattern suggesting, upside exhaustion.
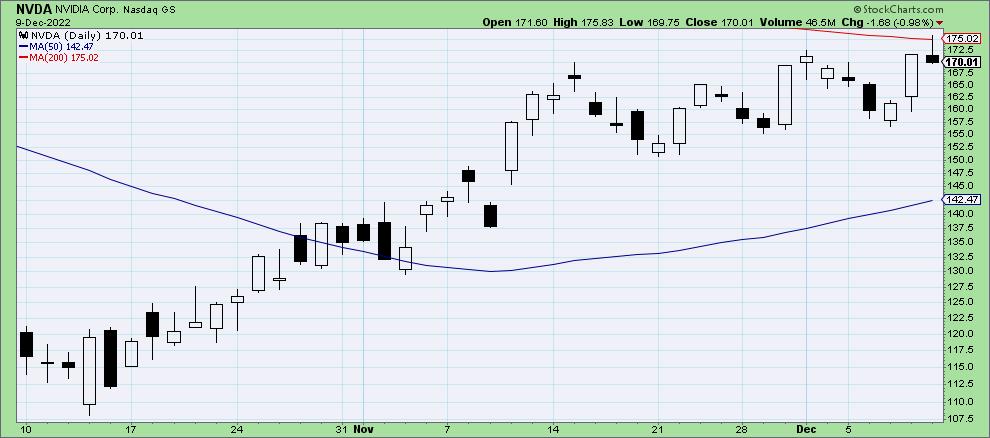
CHART 2: NVDA'S SHOOTING STAR CANDLESTICK PATTERN. Could NVDA's uptrend since October be close to an exhaustion? Chart source: StockCharts.com. For illustrative purposes only.
NVDA is up about 60% from its October low and has formed a sort of ascending wedge pattern in recent weeks. This rally has pushed the stock up to the 200-day MA, which served as resistance for the $SPX and many individual stocks as well.
The shooting star pattern involves a limited lower shadow, long upper shadow, and both the open and close are near the lows of the day. This pattern only appears in an uptrend, as, in a downtrend, the same candle would be termed an "inverted hammer".
This shooting star candle suggests an initial rally during the trading day eventually fizzled out, and the market settled back down to around the opening price. After a big up move, it indicates an exhaustion in the uptrend and increased likelihood of a downside correction.
You'll notice a similar candle pattern for Netflix, although this occurred after the stock has already broken above its own 200-day moving average.
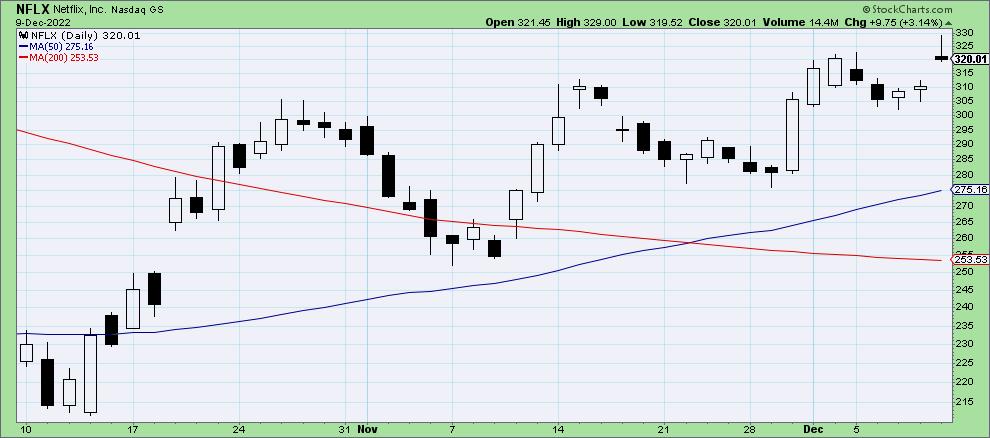
CHART 3: NFLX'S SHOOTING STAR PATTERN AFTER BREAKING ABOVE ITS 200-DAY MOVING AVERAGE. NFLX moved to a new swing high but at the end of Friday's session moved back toward the low. Chart source: StockCharts.com. For illustrative purposes only.
Here we see the upside acceleration after NFLX broke above the 200-day MA, followed by a retest of this long-term barometer in early November. This week, the stock moved on to a new swing high before Friday's session became another shooting star candle.
So NFLX opened on Friday and moved to a new swing high, only to see that advance repelled as the price moved back toward the low for the session. Again, upside momentum was exhausted.
The S&P 500 Into Next Week
So where does that leave the major averages? Well, when mega-cap names like NVDA and NFLX are showing bearish candle patterns, I immediately become skeptical of the probability of further upside—at least, until we see a short-term reaction to Friday's close.
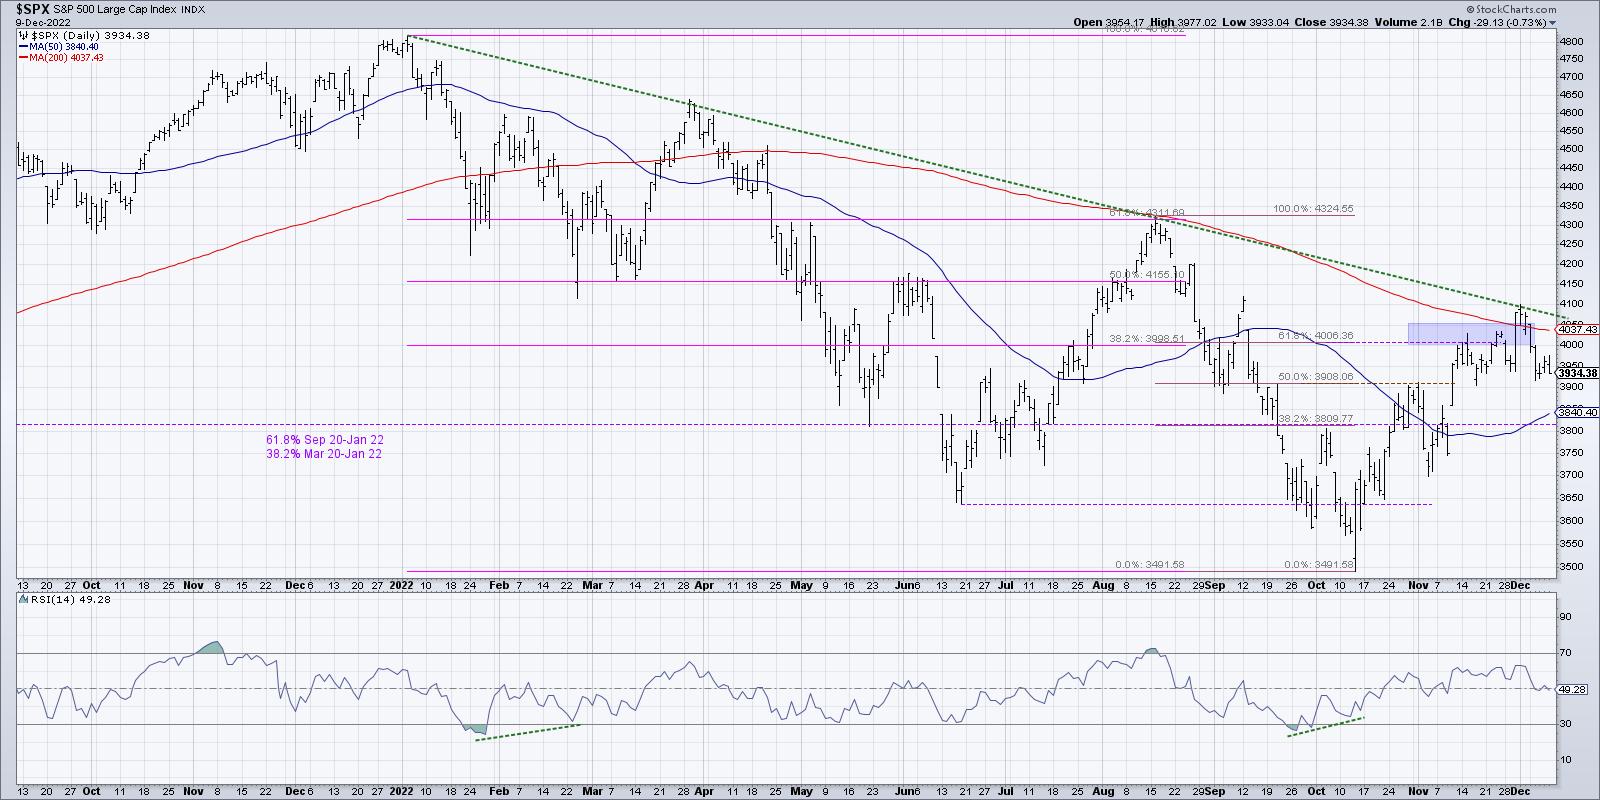
CHART 4: IS THE $SPX ALSO SHOWING A BEARISH PATTERN? On the daily chart above, you see that $SPX broke above its 200-day MA on December 1 and tested its long-term trendline resistance. Chart source: StockCharts.com. For illustrative purposes only.
The $SPX's rally phase may have reached its climax, with a break above the 200-day MA and a test of long-term trendline resistance perhaps proving too much for bulls to overcome.
My conversation with Frank Cappelleri on Thursday focused on the lack of upside follow-through we have noticed on $SPX. In bull market phases, charts tend to break out and keep going higher. In bear market phases, charts will often experience "false breakouts" where price moves above resistance and then quickly reverts back lower. We are seeing much more of the latter.
Next week we have the Fed meeting, and we also are now in the meat of the seasonally strongest part of the year. I'm talking with Jeff Hirsch of the Stock Trader's Almanac on Monday's show and will hope to dig a little more into seasonal strength in December, which is often followed by seasonal weakness in January.
What will the future hold? None of us knows for sure. But I do know that, by starting with the final bar, we can be much better prepared for any potential outcomes!
RR#6,
Dave
P.S. Ready to upgrade your investment process? Check out my YouTube channel!
David Keller, CMT
Chief Market Strategist
StockCharts.com
Disclaimer: This blog is for educational purposes only and should not be construed as financial advice. The ideas and strategies should never be used without first assessing your own personal and financial situation, or without consulting a financial professional.
The author does not have a position in mentioned securities at the time of publication. Any opinions expressed herein are solely those of the author, and do not in any way represent the views or opinions of any other person or entity.


