Position for the most probable scenario, but plan for alternative scenarios.
Why is this a sentence that should be printed out and taped to your monitor, now if not sooner? Because, as investors we often become very tied to a particular narrative.
The Fed is wrapping up its tightening cycle and then it's off to the races!
This recession is going to be way worse than anyone expects.
Earnings are going to solid this quarter, and the market will pound higher.
There's no way we break above the August high.
There's no way we go below the October low.
Market history is filled with events that wise and experienced investors never thought would happen. So how do we combat this reality of the financial markets?
Well first, we need to consider different scenarios. If you're bullish here, think through the bearish argument. If you're all bearish with a portfolio full of short positions, list out the reasons why the market could go higher and think through those possibilities.
A novice investor becomes married to an investment thesis, goes all in with their positioning, and assumes they'll be right. An experienced investor thinks through alternative scenarios, positions their portfolio to profit from the most likely scenario, but also develops a good game plan in case their alternate hypothesis become reality.
Let's review the current chart of the S&P 500 index.
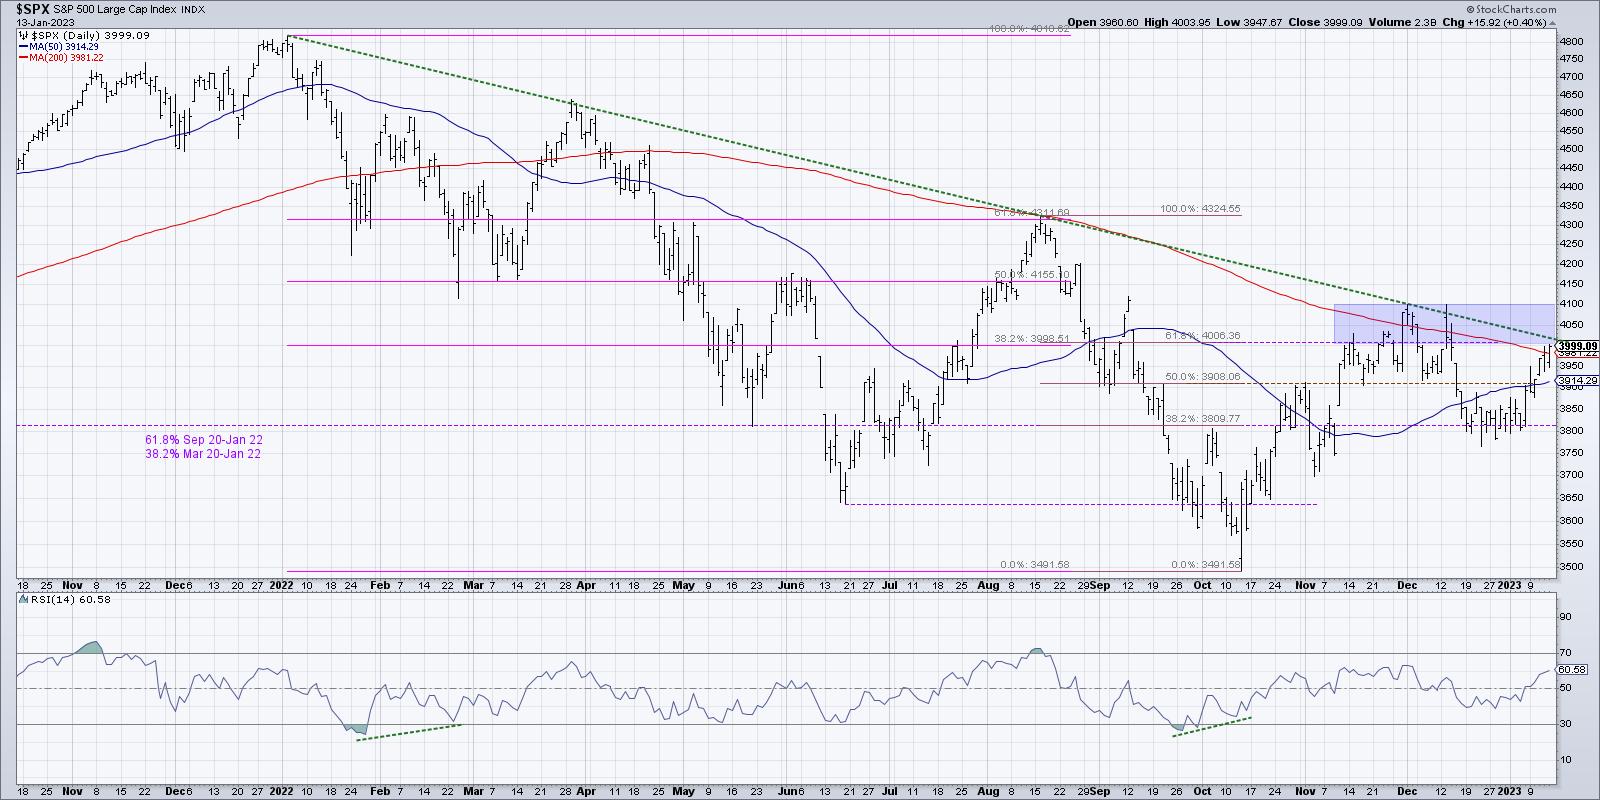
This is one of those times where we can draw a trendline that almost perfectly tracks the downtrend channel displayed by the SPX over the last 12 months. And the first question in any scenario is, "Do we break above trendline resistance?"
After that, we need to consider key levels of support and resistance. What would it take for the S&P to break above 4100? What about the August 2022 high around 4300? On the downside, we have 3800 level which was tested in December, along with the June and October lows at 3650 and 3500.
Here is a chart summarizing four scenarios, followed by a description of each of the four potential outcomes. Which do you see as the most likely, and why?
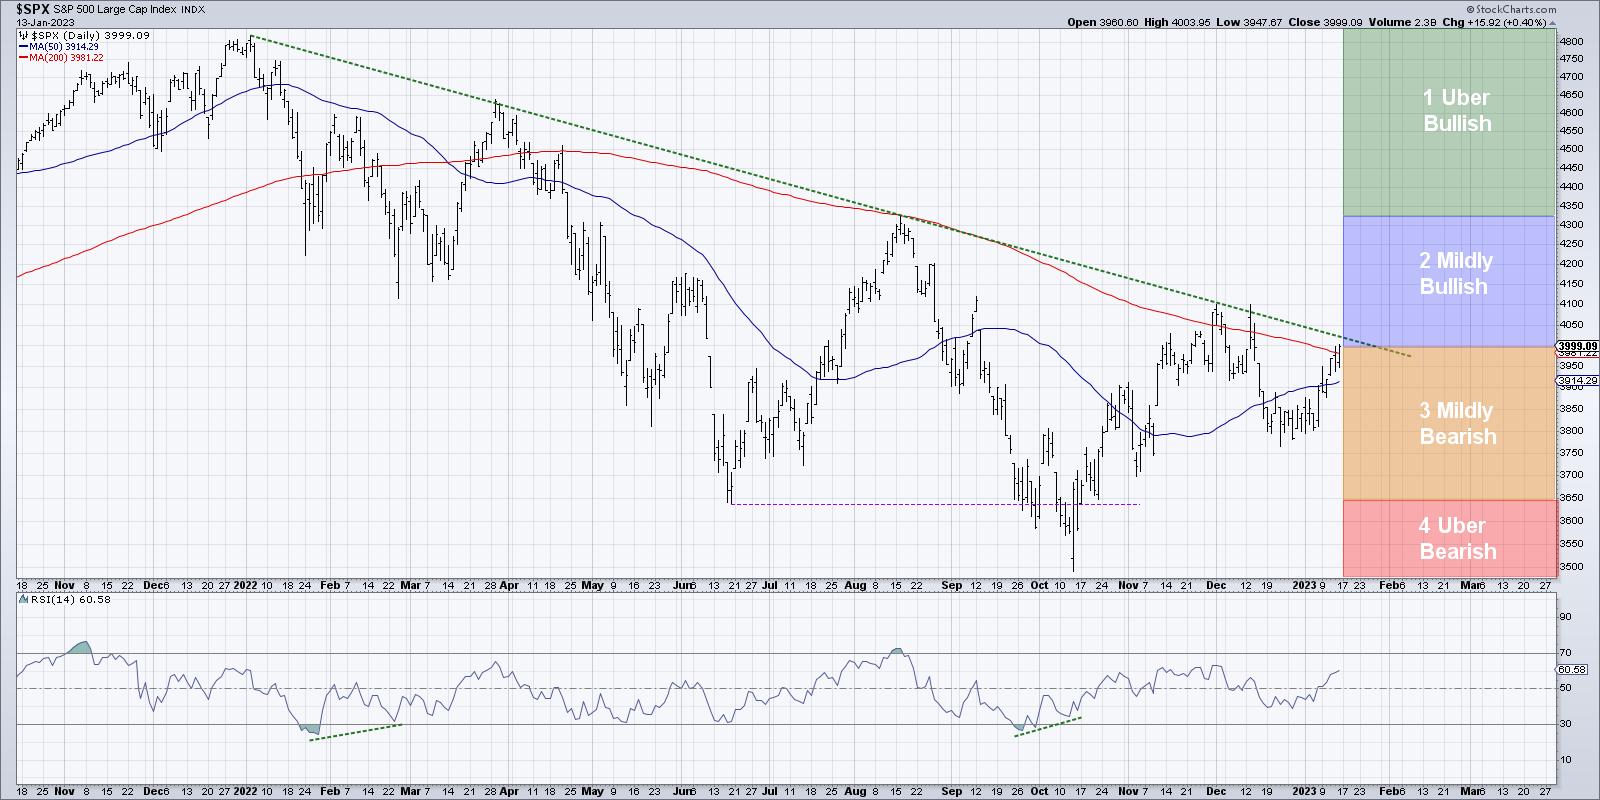
1. The Uber-Bullish Scenario
This week, I talked with Jeff Hirsch about the Presidential cycle so brilliantly laid out in this year's Stock Trader's Almanac. He shared that the pre-election year is usually quite strong in the first half and tends to have a much less bullish average second-half performance.
So, in this first scenario, the S&P blows right through trendline resistance and leaves the 200-day moving average in the dust. Not only that, it powers right through 4100 and also breaks out above 4300, which is the August 2022 high.
What would have to happen for this series of events to play out? Well, the Fed would need to near the end of the tightening cycle. Inflation data would need to show further evidence of an economic slowdown. And interest rates would most likely need to remain lower to give growth stocks an opportunity to rally much further than they have so far.
2. The Mildly Bullish Scenario
In this somewhat less euphoric option, the S&P 500 still breaks above the trendline and moving average resistance, but doesn't make much headway beyond 4100. Perhaps we retest the August high at 4300, but, by then, the optimism that we have experienced since the October low begins to dissipate.
If the bearish macro headwinds remain in spite of stock market strength, this could be the scenario that plays out. There's enough upside momentum to push stocks a bit higher, but not enough to make it an obvious raging bull market environment.
Quite simply, the prospects of expected macro headwinds minimize the upside for risk assets.
3. The Mildly Bearish Scenario
Now we're thinking through a scenario where the market fails to eclipse key resistance, fails to overcome the thick green trendline and fails again to break out above the 200-day moving average.
Perhaps the Fed tightening cycle continues a little longer than expected, or maybe we get some bullish economic indication showing that the economy is not slowing enough, or it could be that this earnings season takes a dark turn as companies project major league headwinds for their businesses in 2023.
For whatever reason, the rally from the October low ends up being just another bear market rally, and the downtrend that began in January 2022 is not yet complete. But in this mildly bearish scenario, we don't get below the June 2022 low around 3650, and instead we continue this "backing and filling" process that has played out since last May.
4. The Uber-Bearish Scenario
This brings us to the real down, the outcome where things just get really bad really quickly. The market fails to breakout, but then the downtrend is re-initiated and the S&P and Nasdaq retest their 2022 lows. Either or both of these benchmarks probably make a new low for the cycle, and stocks that have seen solid performance in the last 2-3 months stall out and rotate back to a pattern of distribution.
The dreaded "R" word (RECESSION!) came up in my discussion with Tony Dwyer this week, who pointed out that his long-term analysis of yield curve inversions and recessionary periods suggests that the bear market phase is just not over yet. So this fourth scenario means the worst-case outcomes indeed play out, the Fed continues a tightening cycle into mid-2023, and inflation remains a central theme for risk assets.
In this probabilistic analysis, the point is not just to vote on which scenario is most likely (although please head over to my YouTube channel and let me know what you think!) but more about forcing yourself to think through these different outcomes. To have proper risk management, you need to be able to think through potential risks and visualize how they may play out. Only then will you be truly prepared for whatever lies ahead.
Position for the most probable scenario, but plan for alternative scenarios!
More of a video person? You can experience this article in video format over at my YouTube channel.
RR#6,
Dave
P.S. Ready to upgrade your investment process? Check out my YouTube channel!
David Keller, CMT
Chief Market Strategist
StockCharts.com
Disclaimer: This blog is for educational purposes only and should not be construed as financial advice. The ideas and strategies should never be used without first assessing your own personal and financial situation, or without consulting a financial professional.
The author does not have a position in mentioned securities at the time of publication. Any opinions expressed herein are solely those of the author and do not in any way represent the views or opinions of any other person or entity.
