TAKEAWAYS
- We use a series of weekly exponential moving averages to define the trend on three time frames.
- The medium-term model just turned bullish, suggesting a risk-on environment for stocks.
- Our Market Trend Model had a similar setup in March 2022, before a downturn eliminated the bullish configuration.
Am I bullish or bearish? Should I be focusing more on capital growth or capital preservation? Do I have permission to buy breakouts?
With this week's impressive rally phase, my proprietary Market Trend Model has now turned bullish on all three time frames. While I can come up with all sorts of subjective measures to back up any way you want to answer those previous questions, I have found that a systematic analysis of trends is a much more effective approach.
I'm going to share a Market Trend Model that I've been running for years, mainly to inform discussions with my Market Misbehavior premium members. I'll show you how it's calculated, why considering multiple time frames is so vital for investors, and what may be next for the S&P 500 now that the model has turned bullish.
Managing Multiple Time Frames
I tend to think of the market in three timeframes:
- Short-Term, a couple days to a couple weeks
- Medium-Term, a couple months
- Long-Term, a couple years
As you can tell, these are pretty general time frames, and I tend to favor approaches that give me flexibility in case the market conditions suggest doing so. To be honest, I feel that some of the great benefits of technical analysis are that it allows you to be flexible, it enables you to adapt to changing market conditions, and it empowers you to admit you are wrong!
My general timeframe of interest is the medium-term, which means I'm generally looking out about 1-3 months. By using the 5 and 13-week exponential moving averages, I'm able to clearly define the trend on this time frame and recognize when there has been a shift in trend.
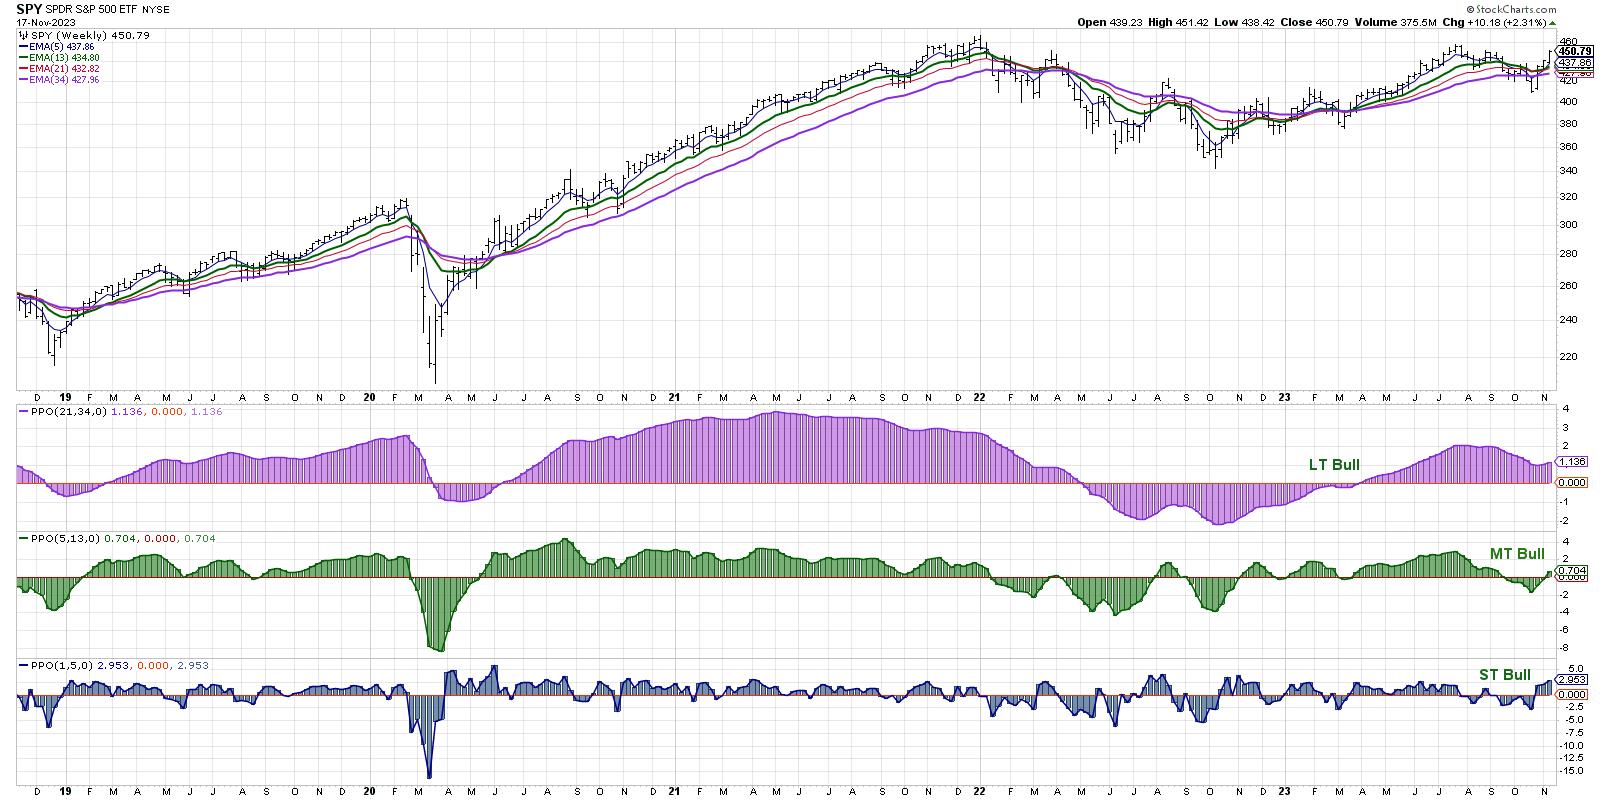
You have to remember that the medium-term time frame is comprised of shorter upswings and downswings, which I describe as the short-term time frame. This is where swing traders are able to benefit from buying low and selling high, and long-term investors can benefit from optimizing entry and exit points. While I usually analyze short-term trends using a daily S&P 500 chart, I can also look at the current price relative to the 5-week exponential moving average for a simple gauge of the short-term trend.
Finally, you have to recognize the longer time frame that covers multiple years. This is where we need to consider the business cycle and how sectors and themes can come in and out of favor over time. By comparing the 21- and 34-week exponential moving averages, I'm able to effectively track these longer-term trend shifts and reflect on the larger cycles at work.
Putting Recent Market Action into Proper Context
As you can see from the chart, this week's strong performance moved the medium-term model from bearish to bullish. This brings all three time frames to the bullish range for the first time since July, and suggests that the rotation from a bearish October to a so-far quite bullish November was enough to indicate a high likelihood of further upside.
The long-term model has actually been bullish since the end of May, when the rally off the October 2022 lows had shown enough of an upside follow-through to confirm a cyclical bull market. The two most recent bullish signals from the long-term model, in February 2019 and June 2020, led to much further upside for the equity benchmarks and reinforced the overall bullish environment for stocks.
The bounce off the October low was sudden and severe, which caused the short-term model to quickly turn bullish. But as the medium-term model is my main risk-on/risk-off measure, it's only now giving me the permission to focus more on capital growth than capital preservation.
What's Next for the S&P 500?
What concerns me about the current configuration? Well, we've seen this before. Look back to early 2022 and you'll see a similar setup of the short-term and medium-term models turning negative even as the long-term model remained bullish.
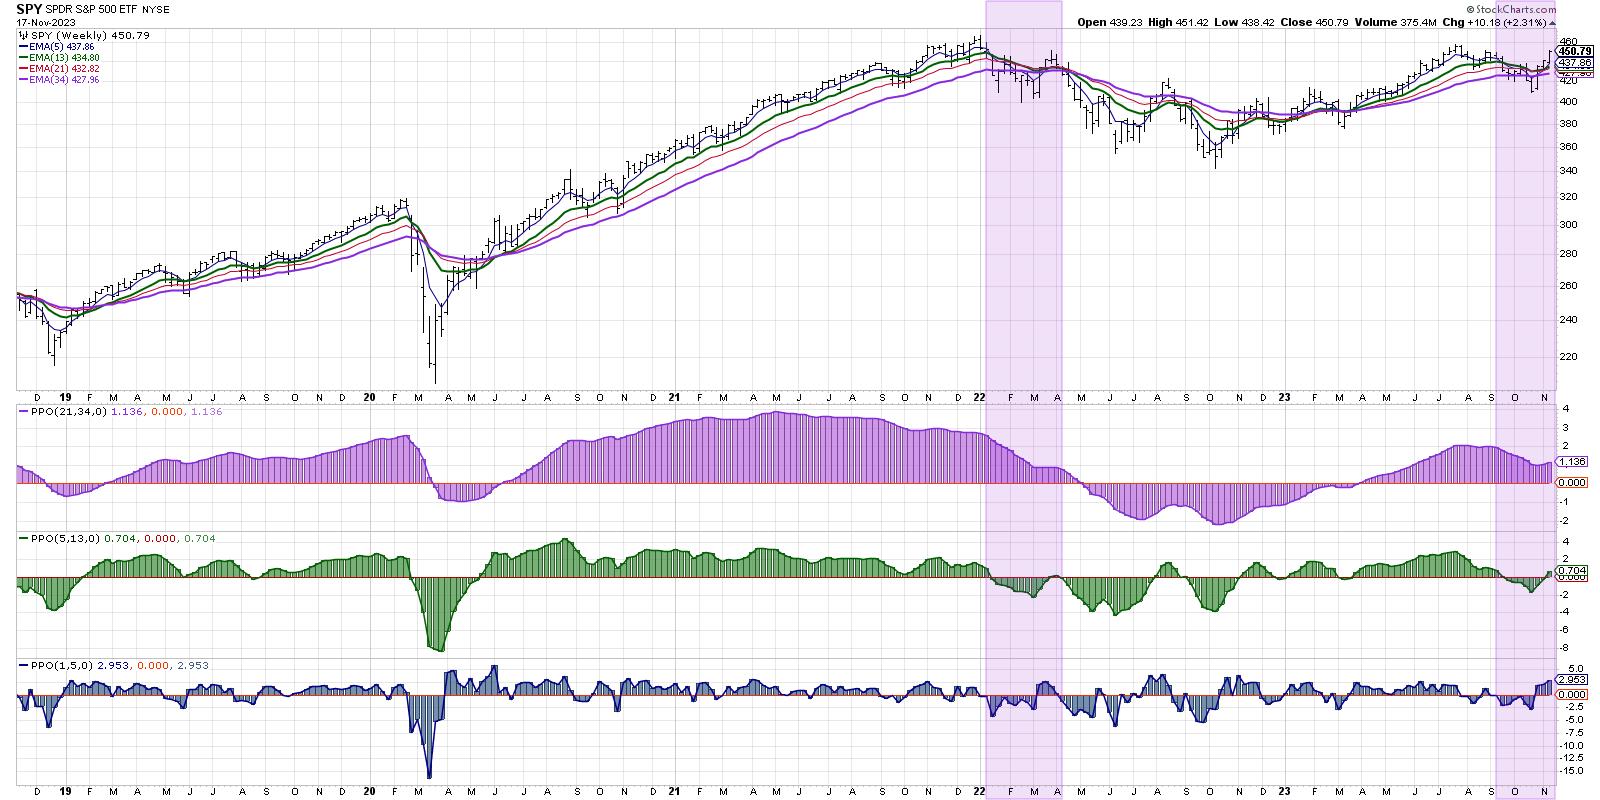
The March 2022 bounce higher certainly appeared to be the beginning of a retest of the late 2021 high. The long-term model was declining, yet it remained in the bullish range. The medium-term and short-term models both turned bullish in March 2022, confirming this upside bounce in price.
The medium-term model only remained slightly above zero for 2-3 weeks before going back to the bearish range. The S&P 500 ended up progressing lower to establish the June and October 2022 lows before finally turning higher in the fourth quarter.
For now, I'm inclined to remain bullish as long as the medium-term model remains bullish. Every week that the medium-term model sits above the zero level, that's one more week where buyers appear to outweigh sellers!
RR#6,
Dave
P.S. Ready to upgrade your investment process? Check out my free behavioral investing course!
David Keller, CMT
Chief Market Strategist
StockCharts.com
Disclaimer: This blog is for educational purposes only and should not be construed as financial advice. The ideas and strategies should never be used without first assessing your own personal and financial situation, or without consulting a financial professional.
The author does not have a position in mentioned securities at the time of publication. Any opinions expressed herein are solely those of the author and do not in any way represent the views or opinions of any other person or entity.


