TAKEAWAYS
- The short-term trend for the QQQ is positive after this week's rally, but price is now at the upper edge of a downtrend channel.
- On the medium-term timeframe, the downtrend channel is still intact, and the momentum reading is still in line with a bearish phase.
- The weekly chart shows the recent pullback for the QQQ as a brief drop within the context of a long-term bullish trend.
"Are you bullish or bearish on the Nasdaq 100?"
I often get asked this or a similar question for the S&P 500, gold, bonds, individual stocks, Bitcoin, and pretty much anything else you can imagine that has a price. My follow-up question is always, "Well, what's your timeframe?"
It's tempting to analyze a chart, measure the trends, break down all sorts of technical indicators, and then boil it down to one single call: bullish or bearish. But mindful investors know that the market moves on multiple timeframes, with short-term ripples turning into medium-term waves, which are part of the long-term tides.
Given this week's sudden rally, reversing last week's dismal deterioration, I thought it be helpful to focus in on the Nasdaq 100 and identify the trends on three different timeframes. I think you'll find that while the tactical timeframe ended this week in a bullish phase, the medium-term timeframe may provide better clues about what's next for stocks.
Short-Term: Rally Mode but Testing Resistance
You can't deny the strength of the uptrend this week, which provided a stark contrast to last week's dredging. Last week, we saw a clear distribution, as three of the five trading days ended near that day's low. This week, instead, most day's sessions closed near the top of the daily range.
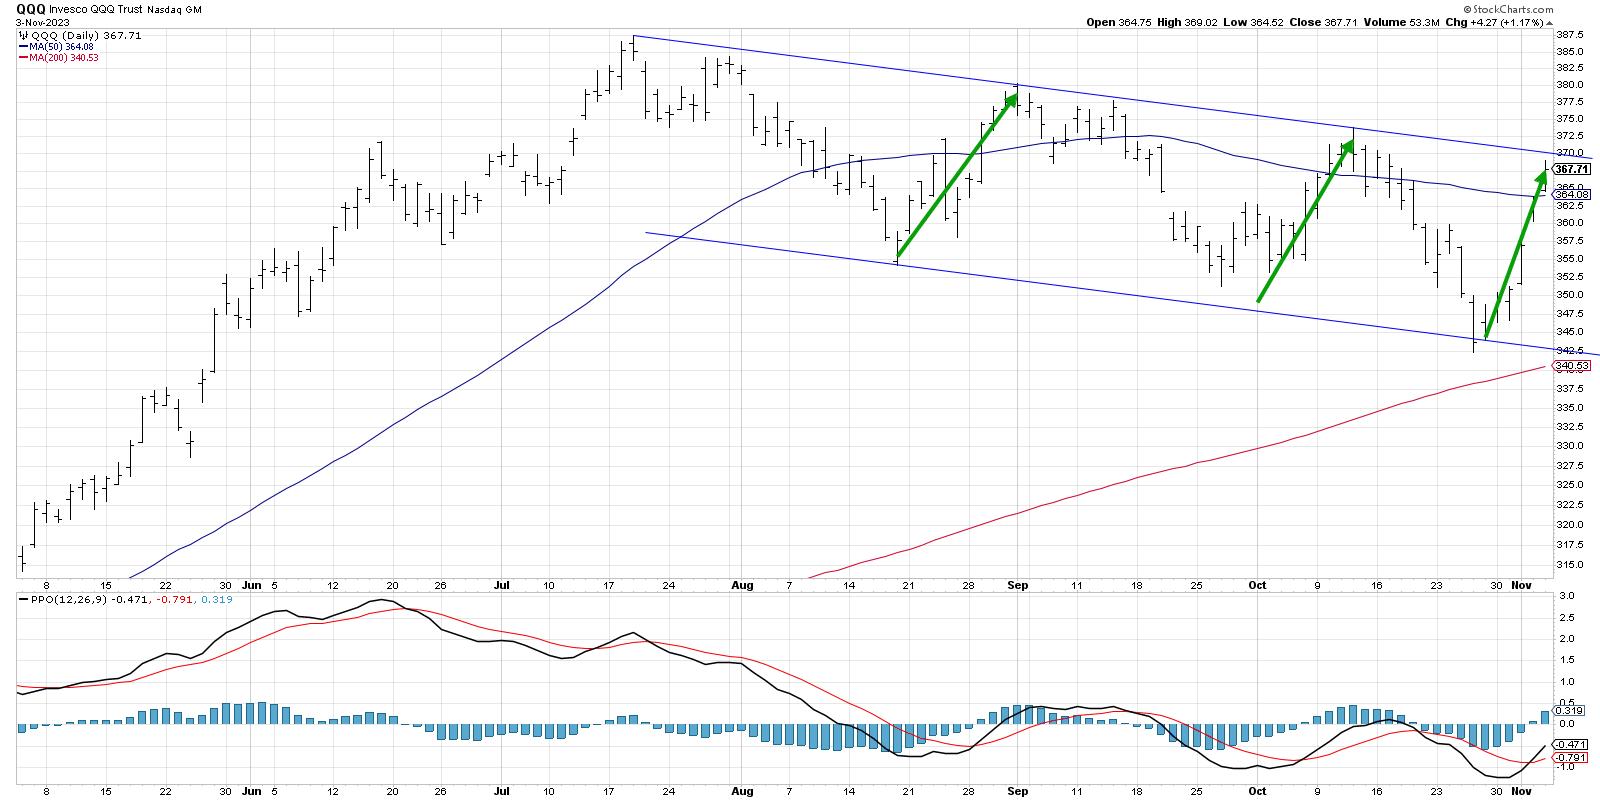
The last three months have developed a clear pattern of lower highs and lower lows on the chart. Notice how the current upswing appears very similar in price change and time duration to previous rallies in early October and late August? Now look down to the RSI, and you'll see that the RSI is right around 60, pretty much where the indicator topped out in those previous two countertrend upswings. So while this recent rally has been sudden, severe, and seductive, it actually tracks quite well with other bear market rallies we've experienced.
Thus, while I'm drawn in by the intensity of this recent rally, I wouldn't be surprised to see at least a brief pullback from this clear resistance level.
Medium-Term: Downtrend Still in Place
When you take a step back to a two-year daily chart, you'll see how the downtrend channel fits into the overall trends of 2022-2023. On the medium-term time frame, I've considered this market as guilty until proven innocent. Once this consistent pattern of lower highs and lower lows appears, I think you have to assume that the downtrend will persist until proven otherwise.
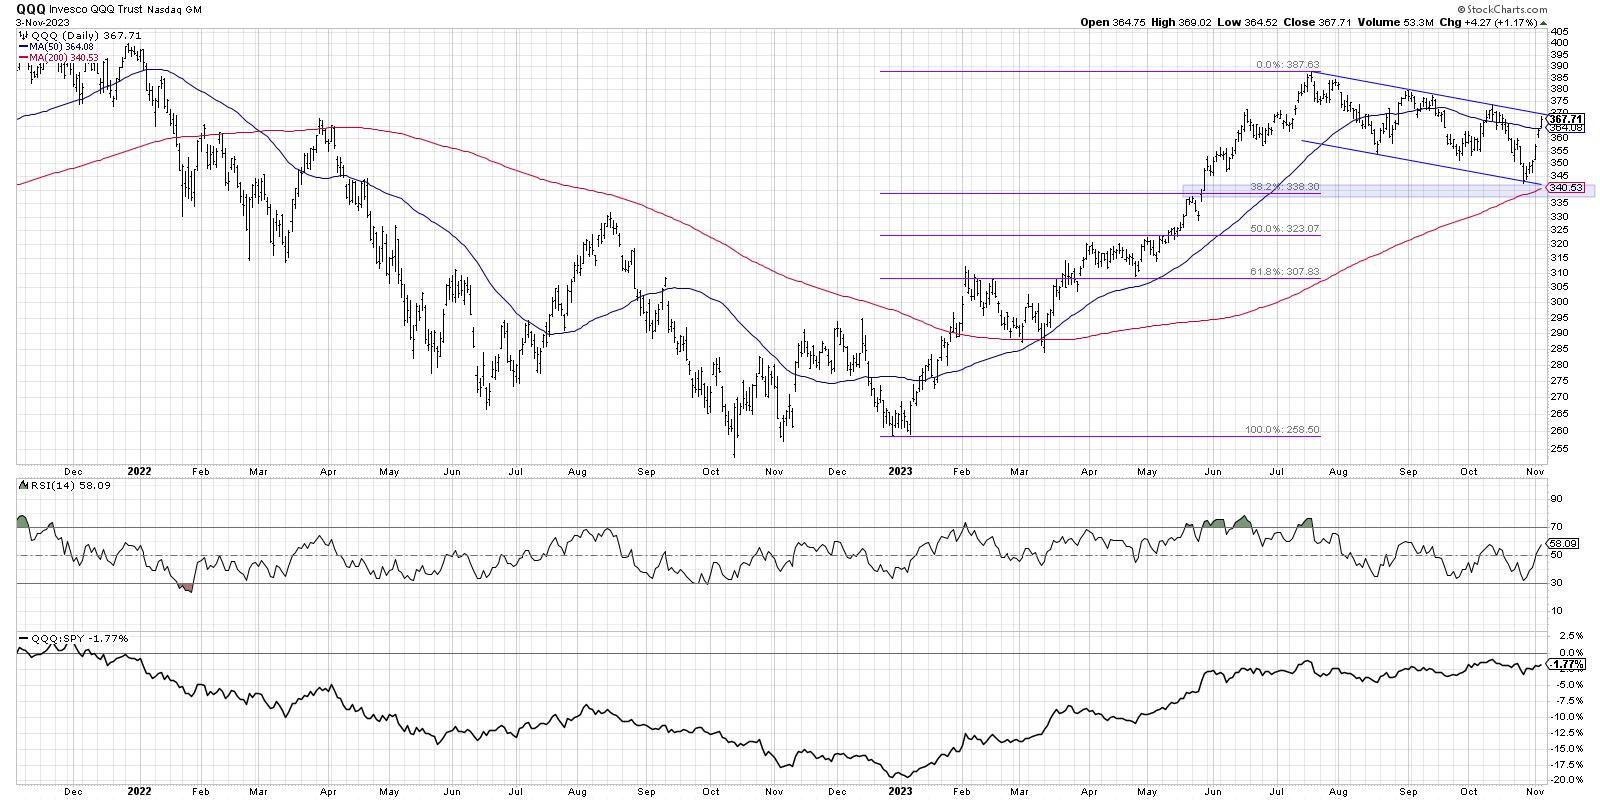
So what would we need to see to turn more bullish on the medium-term time frame? First, I'd watch for a breakout through the upper boundary of this trend channel. Friday's move higher made me think we might see a breakout before the weekend, but now I'd say this is the most important line to watch in the week to come. A breakout would suggest that new buyers are entering the market or at least that the pessimism that has pervaded this market into the fourth quarter is starting to dissipate.
Another indication to watch for would be the RSI pushing above the key 60 level. Recent countertrend rallies saw the RSI top out around 60, so a price breakout accompanied by an RSI pushing above 60 could validate a more constructive medium-term thesis.
Long-Term: Bullish Thesis Remains Intact
Why is the long-term picture still bullish in my opinion? Because the downtrend starting in July didn't break below the first Fibonacci support level around 338. Because the Nasdaq 100 remained above its 200-day moving average. Because when you zoom out to the weekly chart, the recent correction seems fairly minor by historical standards.
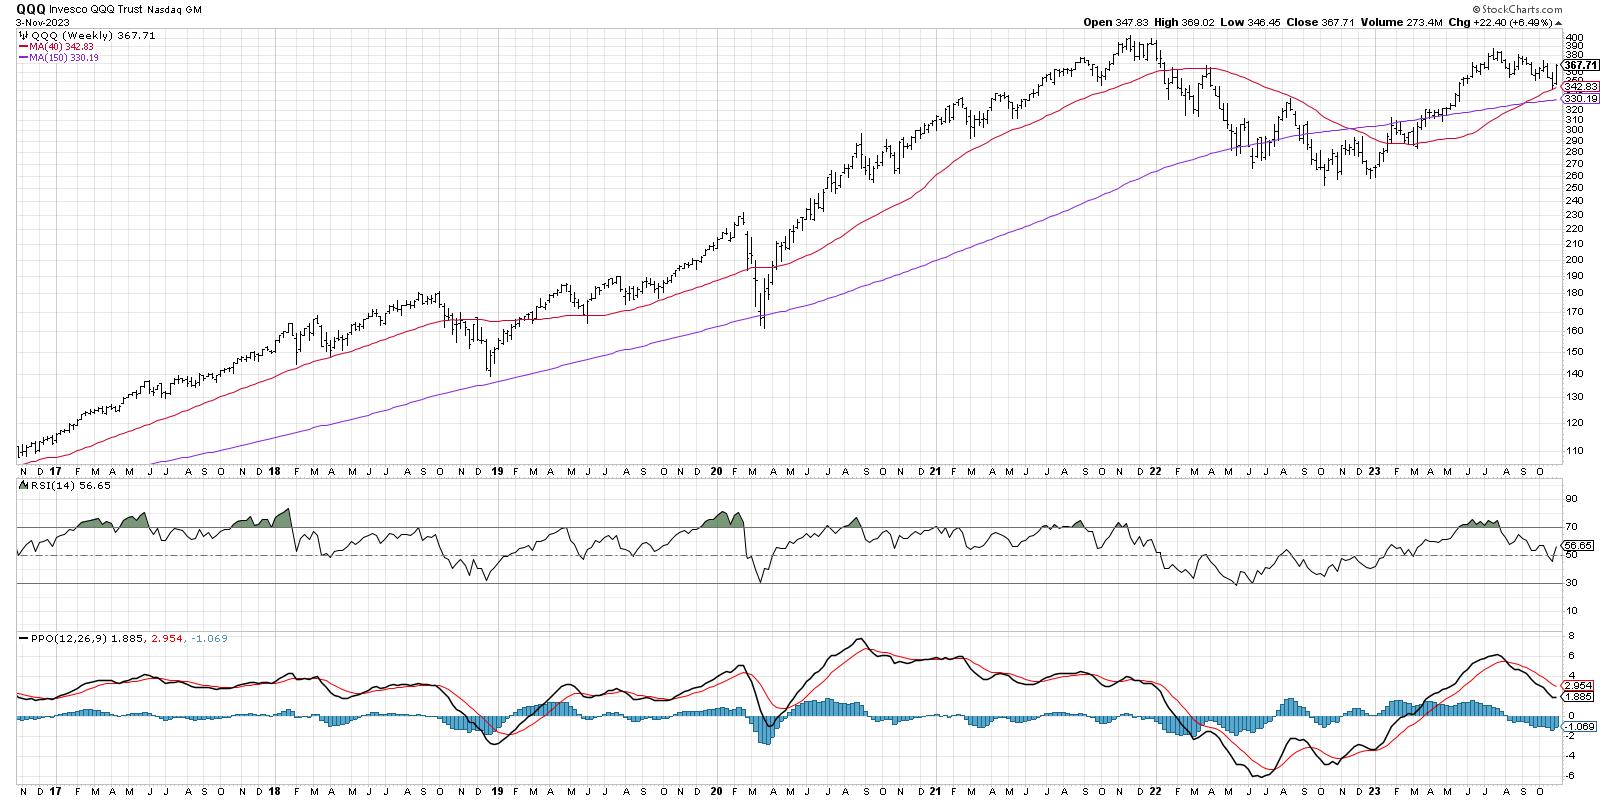
The weekly QQQ chart illustrates how the real painful corrections start with a break below the 40-week moving average but then usually keep going. This is why so many investors track the 40-week or 200-day moving average because as long as the market remains above this key long-term barometer, any pullback is just not severe enough to break the larger trend.
The weekly RSI is back above 50, and we are not too far below all-time highs for this leading growth index. So while the medium-term trend is still bearish by my read, the long-term charts show how we should still consider 2023 as part of a larger bull market structure.
Which time frame is most important to you? What is your average investment horizon? However you would answer those questions, never forget the value of going one time frame larger and one time frame smaller. Only by considering the trends in other time frames can we better understand our main investing time frame.
RR#6,
Dave
P.S. Ready to upgrade your investment process? Check out my free behavioral investing course!
David Keller, CMT
Chief Market Strategist
StockCharts.com
Disclaimer: This blog is for educational purposes only and should not be construed as financial advice. The ideas and strategies should never be used without first assessing your own personal and financial situation, or without consulting a financial professional.
The author does not have a position in mentioned securities at the time of publication. Any opinions expressed herein are solely those of the author and do not in any way represent the views or opinions of any other person or entity.


