By late October, the market conditions were dire indeed. The S&P 500 had broken below its 200-day moving average for the first time since March. Only 10% of S&P 500 members remained above their 50-day moving average, meaning a full 90% were below this key short-term barometer.
What a change we've seen in the last six weeks!
We finished this week with around 88% of SPX names now above their 50-day moving average, after briefly touching the 90% level on Wednesday. The S&P 500 has now made another new high for the year, ending the week just above 4700. That's right, we're only about 2% below all-time highs!
So are the excessively positive breadth readings in mid-December a good thing or a bad thing for stocks? The reality is a little of both.
Short-Term Upside Seems Limited
Reviewing the percent of stocks above their 50-day moving average, it seems clear that have reached an upside extreme. This indicator rarely touches the 90% level, but it has actually done so three other times in the last 18 months.
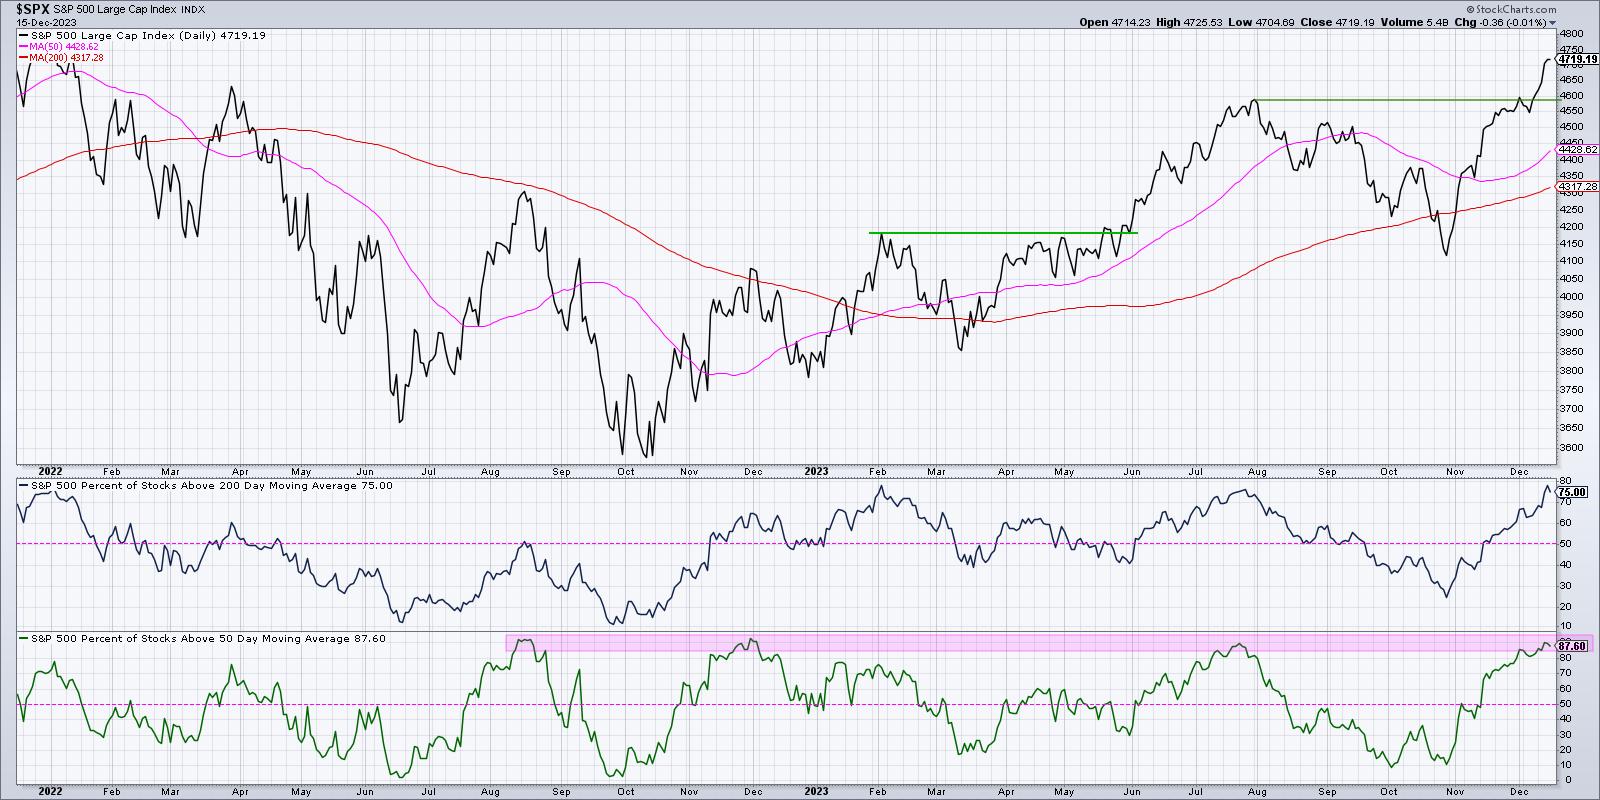
The last time we saw this extreme bullish reading was in July, as the SPX was testing the 4600 level. The next three months saw a steady decline for stocks, ending in the late October low around 4100.
Back in late November 2022, the indicator pushed above 90% as the S&P 500 experienced its initial upward swing after the October 2022 low. The benchmark pulled back for about four weeks before continuing to a new swing high in February.
The third time we witnessed this level of positive breadth was back in August 2022, as the S&P was testing its 200-day moving average from below. This was during the meat of the 2022 bear market phase, so this extremely positive reading was quite unusual. Sure enough, we had about an eight-week decline into the October low soon after.
These three declines, of 10%, 8%, and 17%, respectively, show that breadth is extremely bullish, the short-term picture actually becomes bearish. It's all about the market adjusting lower before continuing the previous trend.
But remember, these were all short-term declines of around four to 12 weeks. What about the long-term implications for these overbought patterns?
Long-Term Picture Remains Positive
It turns out that the returns 6-12 months after these signals are actually quite constructive. So, while the short-term implications are that a pullback is imminent, the long-term indication is more that the uptrend is alive and well.
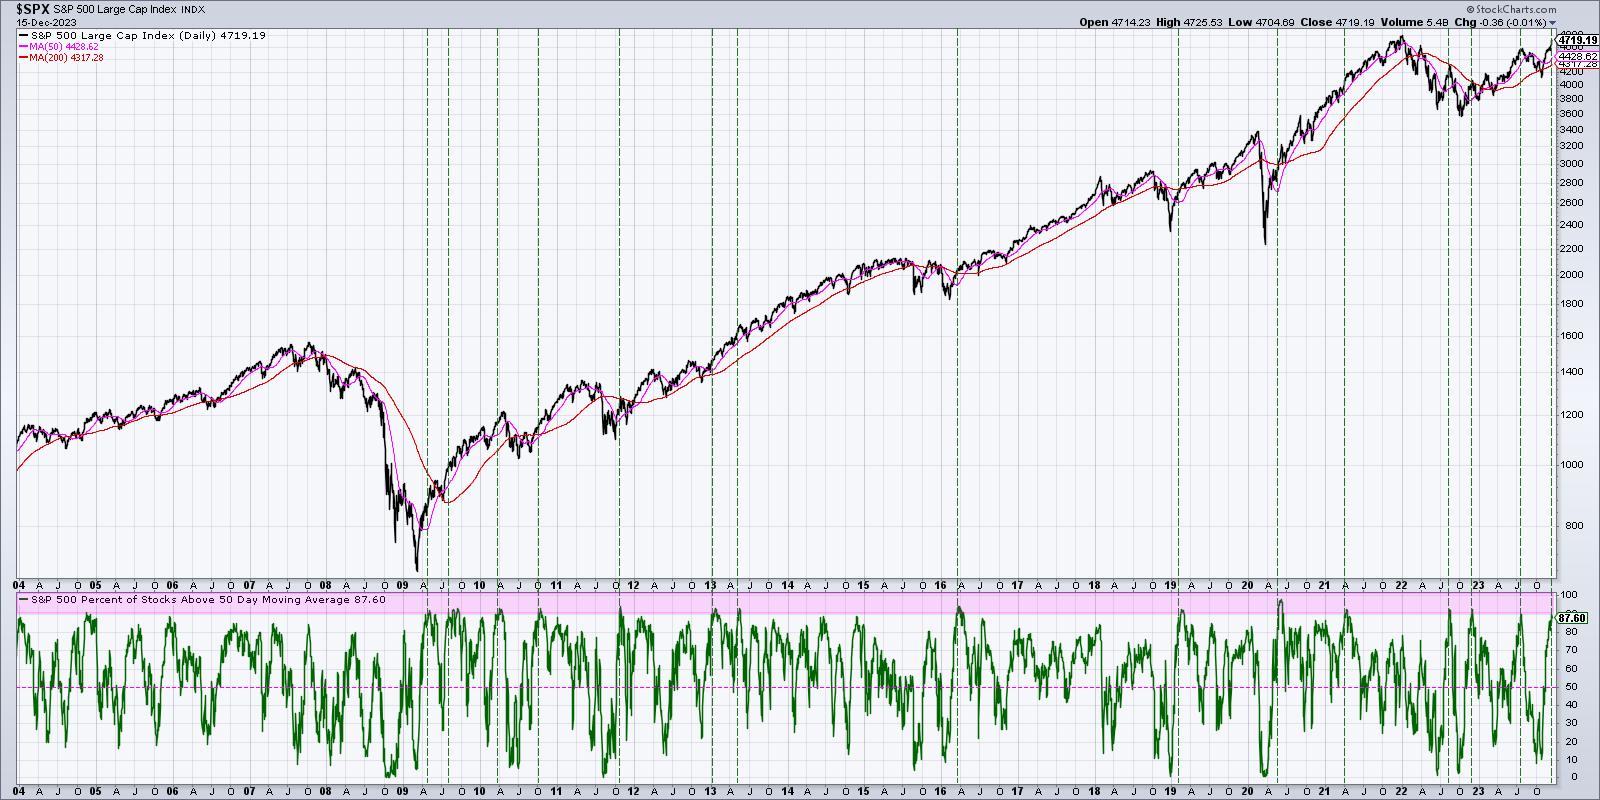
We're now bringing in twenty years of daily data, with the bottom panel showing the percent of S&P 500 stocks above their 50-day moving average. I've highlighted in pink any time this indicator has pushed above the key 90% level, and have also included dashed vertical lines for each indication.
You'll notice that what we discussed above about short-term implications generally holds true over multiple cycles. We often see a pullback soon after the 90% level is reached, or, at the very least, a pause in the uptrend.
But now look at what happens about 6-12 months after these signals have occurred. In pretty much every instance, you'll see that the market has fully recovered after the pullback, often reaching new highs within a year.
Now to be clear, a six-month decline is no small issue. Some would say those can be "career-busting declines" if you're on the wrong side of them! But it should be reassuring as you review this period in market history that these signals have eventually had a very happy ending for equity investors.
What to Expect in Q1 2024
We are currently in the seasonally strongest part of the year, with November and December often experiencing strong returns for stocks. And in a pre-election year like 2023, that seasonal tendency certainly appears to be holding true.
Just this week, we saw additional economic data suggesting that the Fed's efforts to taper inflation appear to have been working. Fed Chair Powell's comments on Wednesday led to the latest up move in this bullish fourth quarter, as investors price in the likelihood that a "soft landing" is more and more a likely outcome.
There remain plenty of risks for equities into Q1 2024, including interest rates pushing back to the upside, volatility popping higher, and the US Dollar returning to its former role as a "wrecking ball for risk assets," as we saw in 2022. But given the strong market breadth readings in mid-December, I would say that the long-term picture for stocks appears to be as strong as ever.
RR#6,
Dave
P.S. Ready to upgrade your investment process? Check out my free behavioral investing course!
David Keller, CMT
Chief Market Strategist
StockCharts.com
Disclaimer: This blog is for educational purposes only and should not be construed as financial advice. The ideas and strategies should never be used without first assessing your own personal and financial situation, or without consulting a financial professional.
The author does not have a position in mentioned securities at the time of publication. Any opinions expressed herein are solely those of the author and do not in any way represent the views or opinions of any other person or entity.


