One of the key themes, if not THE theme, of 2023 was the dominance of the mega-cap growth trade. The Magnificent 7 stocks handily outperformed our equity benchmarks through the course of 2023, and, so far in 2024, it's been more of the same.
With Netflix (NFLX) gapping higher on earnings this week, the stock has certainly appeared to earn a place among the leading stocks of the day. But how do we handle names that have already had incredible runs and now appear overextended?
Today, we'll break down eight leading growth names, which I have loosely called "Magnificent 7 and Friends", and use the technical analysis toolkit to gauge the strength of trends and prospects for continued uptrends. We'll also see what an outlier Tesla (TSLA) has become after disappointing earnings and a price breakdown of epic portions.
The Best of the Best Continuing Higher
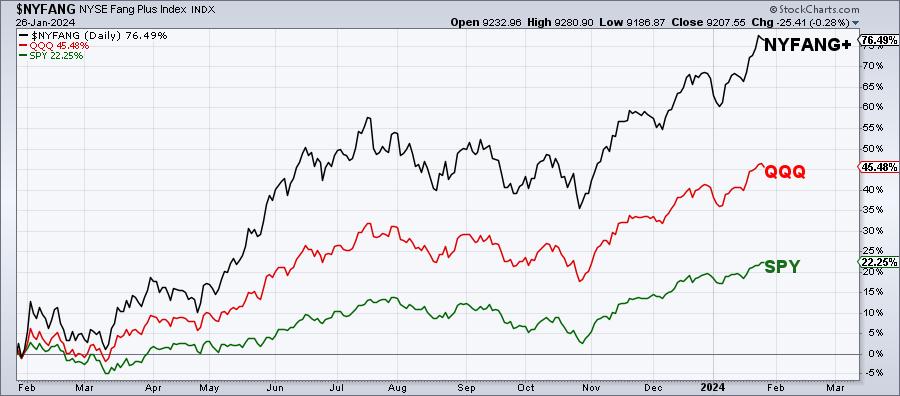
Over the last 12 months, the NYSE Fang Plus Index (NYSE+) has gained 76%, dwarfing the QQQ's +45% and SPY's +22%. While this index includes some other names outside the Magnificent 7, it remains a decent proxy for the strength of the mega-cap growth trade.
The first five charts in this group are similar in that they have broken out of clear basing patterns, and also have shown a clear pattern of higher highs and higher lows. Note how many of these names broke out above resistance, then pulled back to the previous resistance level before accelerating to a new swing high in January.
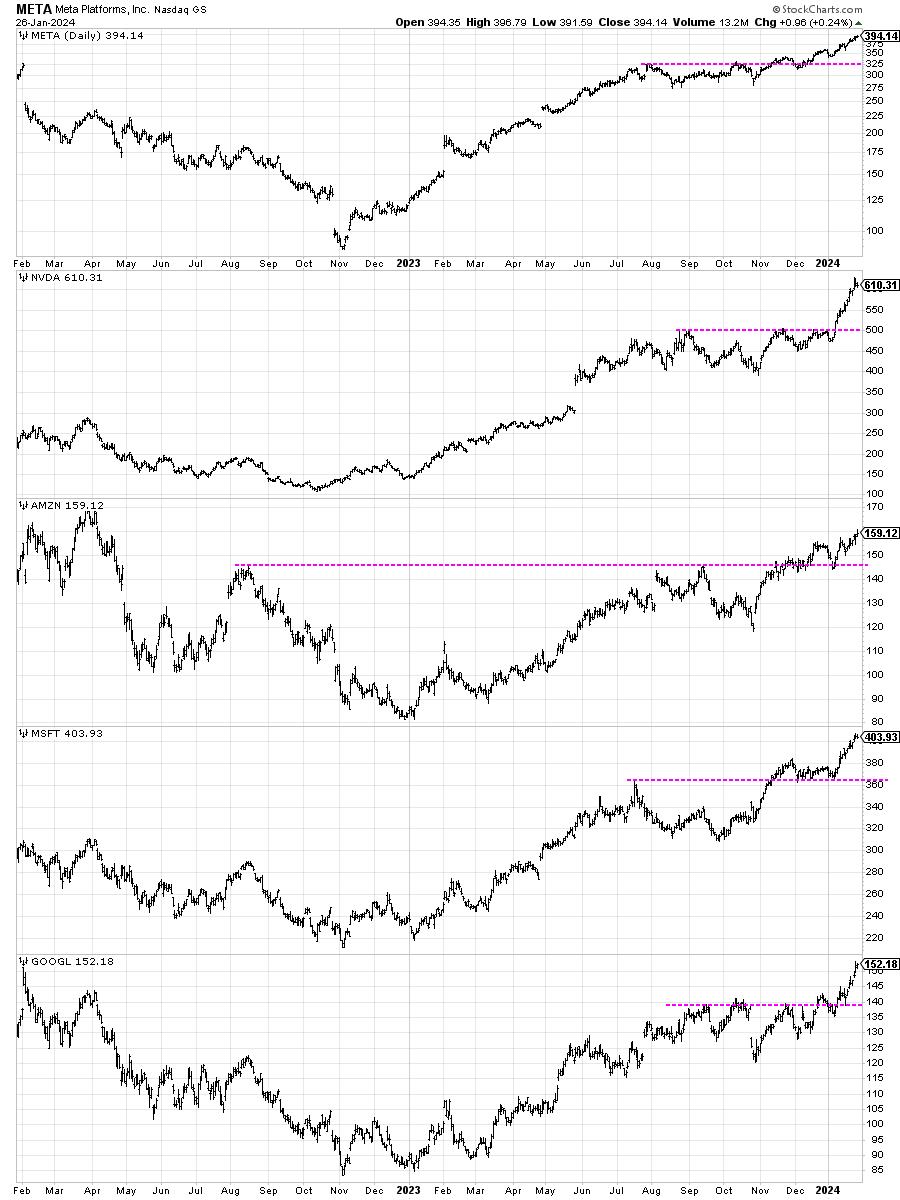
Strength tends to beget further strength, and Charles Dow clarified the importance of this concept by declaring that an uptrend consisted of a pattern of higher highs and higher lows. As long as these charts make a higher swing low on subsequent pullbacks, the primary trend remains bullish.
Netflix is a bit of an outlier, in that it was rangebound (similar to Apple, below) until gapping higher this week on earnings.
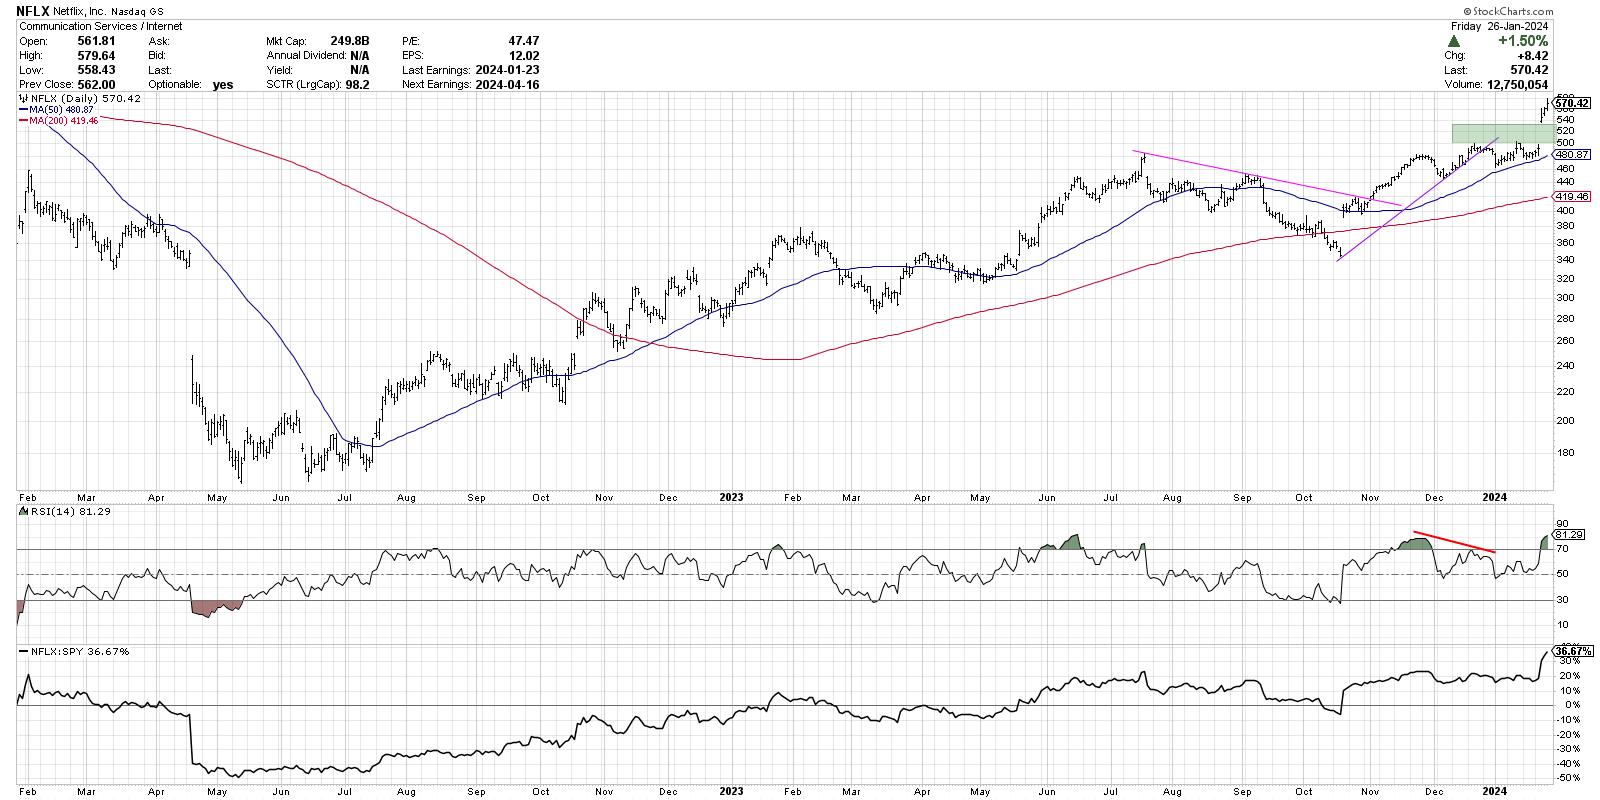
This week's upside gap pushed NFLX above key resistance around $500, and also created a new area of expected support between $500-530. As long as NFLX holds this range on a pullback, I'd consider the overarching sentiment to remain bullish.
One Name Still With Something to Prove
Here's where the charts will start to look a little different than the others we've shared thus far. While the first six names have already broken to new highs, Apple (AAPL) continues to languish below an well-established resistance level.
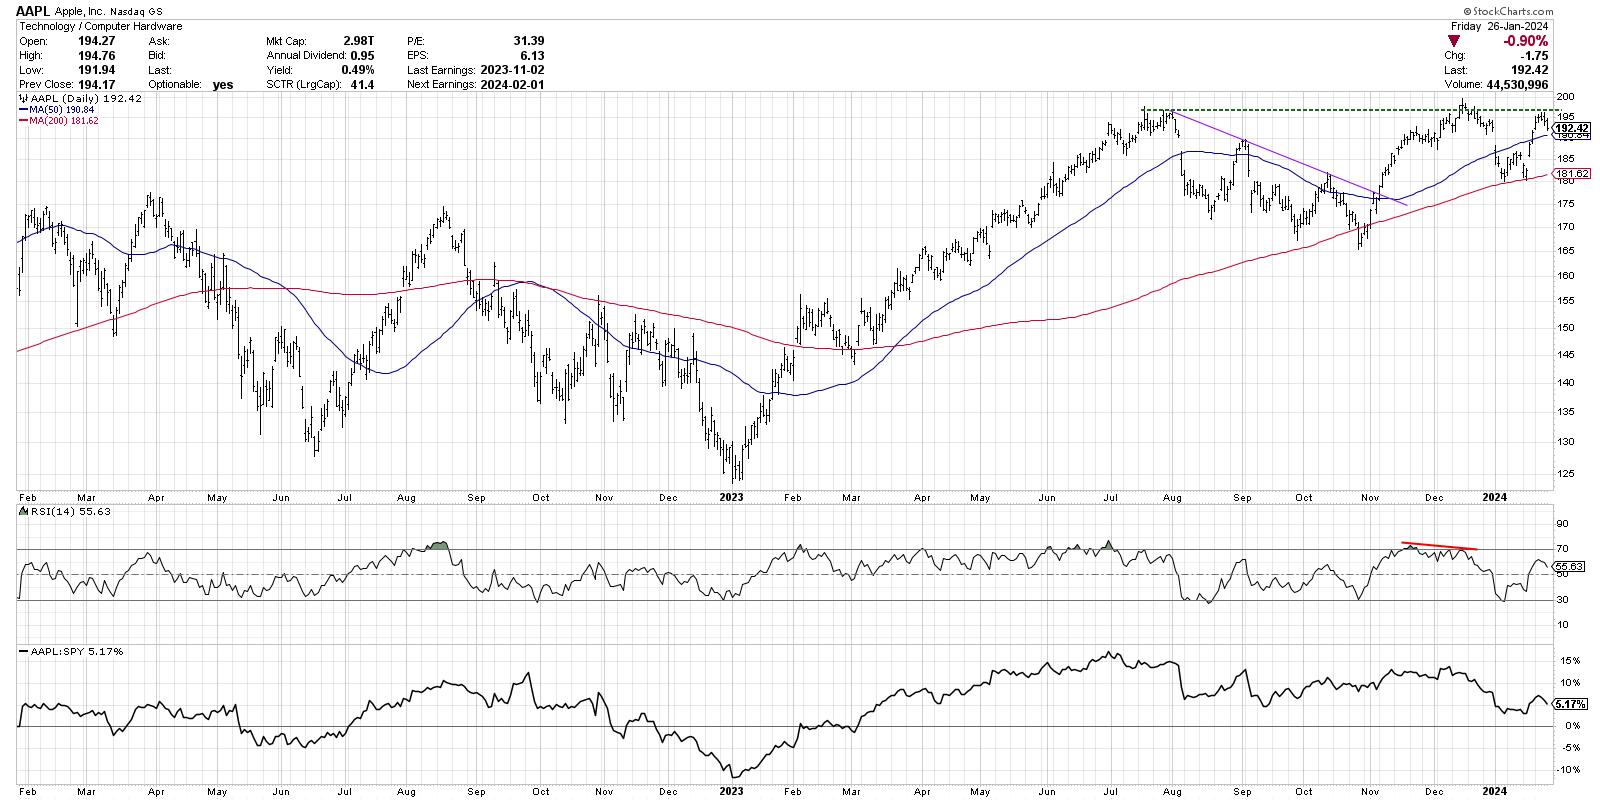
Apple hit a new 52-week high around $197 in July 2023. This level was briefly broken in December, but was unable to sustain those gains as the stock pushed lower to test its 200-day moving average. This week, AAPL once again tested the $197 level but couldn't power above this upside threshold. If and when AAPL gets above $197, and especially if it's able to power above the "big round number" of $200, I would consider this a bullish breakout in line with the previous charts we've presented here.
The Worst of the Worst Has Broken Down
And now we've reached the name which I would consider no longer worthy of membership in the elite Magnificent 7 club. After reviewing the chart below, and comparing it to all other charts we've shared, you'll see what an outlier Tesla has become.
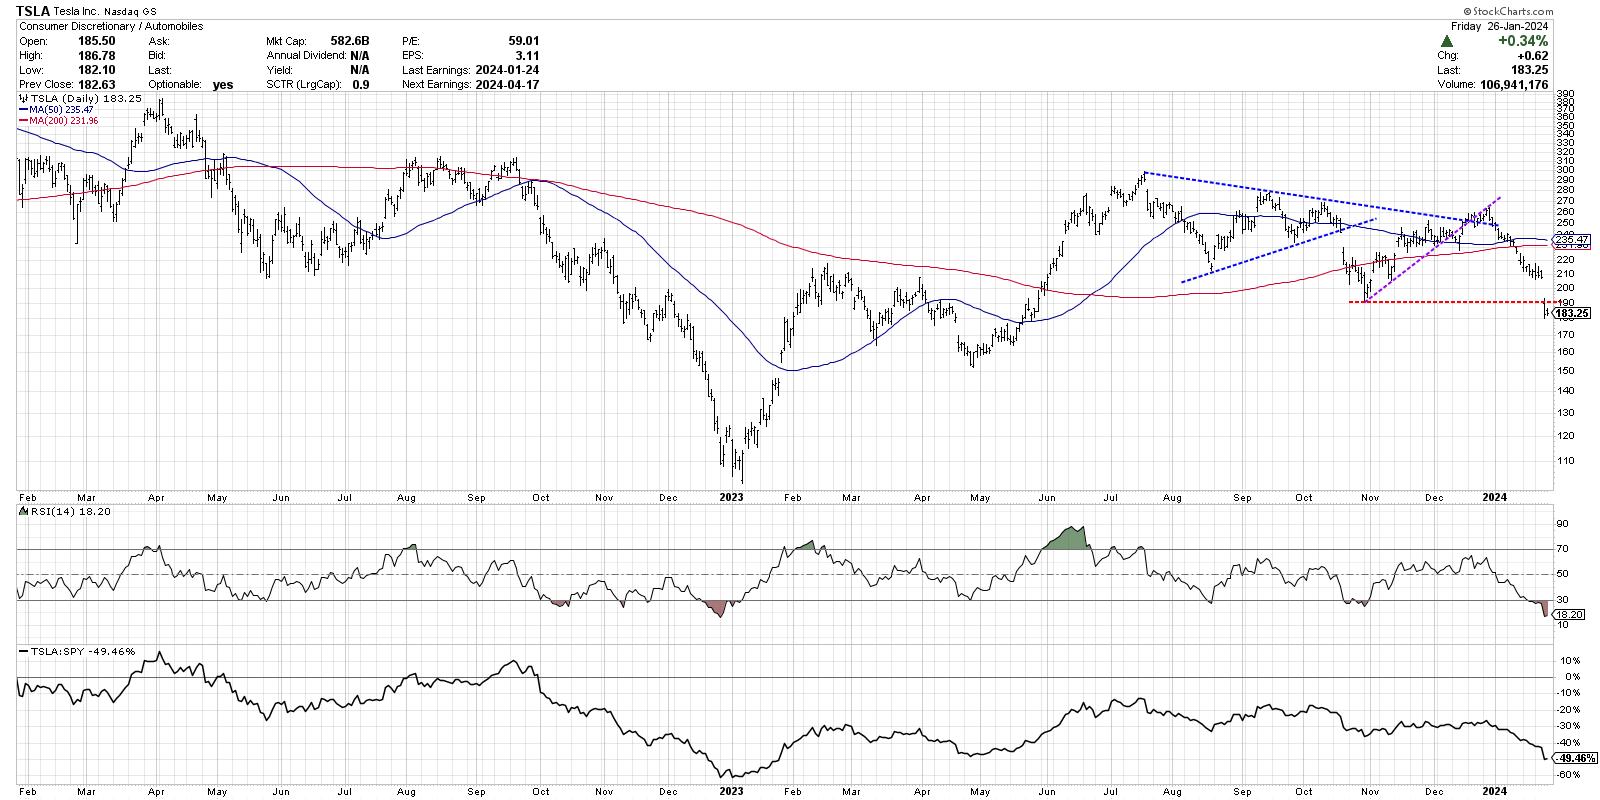
A first glance at the chart shows a similar structure to AAPL through summer 2023, as TSLA was able to reach the $300 market in July. From that point on, however, you'll notice a clear pattern of lower highs and lower lows. This is a Dow Theory downtrend, indicating a primary bearish trend and a general risk-off sentiment.
This week, TSLA gapped lower on an earnings miss, dropping the stock almost 14% for the week and pushing the price below the October 2023 low around $190. Unless TSLA is able to reclaim this level on a swing higher, and then establish a higher low, the primary trend remains down and I'd be very happy looking for better opportunities elsewhere!
Which of the Magnificent 7 (or 8?) stocks do you see as the best opportunity here, and why? By using a simple trend analysis of these names, it can be fairly easy to trim the outliers, focus on actionable moves, and better define potential reward vs. risk.
RR#6,
Dave
P.S. Ready to upgrade your investment process? Check out my free behavioral investing course!
David Keller, CMT
Chief Market Strategist
StockCharts.com
Disclaimer: This blog is for educational purposes only and should not be construed as financial advice. The ideas and strategies should never be used without first assessing your own personal and financial situation, or without consulting a financial professional.
The author does not have a position in mentioned securities at the time of publication. Any opinions expressed herein are solely those of the author and do not in any way represent the views or opinions of any other person or entity.


