TAKEAWAYS
- Jim Miekka created the Hindenburg Omen after studying the conditions present at previous market peaks.
- The Hindenburg Omen triggered an initial signal this week, just as the S&P 500 finally closed above 5000 for the first time.
- If we see a second signal in the next four weeks, this could confirm a major bearish signal for stocks.
The S&P 500 shall heretofore be known as an index that has broken the incredible 5,000 level. That alone is a pretty amazing milestone for a benchmark that was down around 3500 just over a year ago! But another significant signal may be developing as well, that being the dreaded Hindenburg Omen.
But what is the Hindenburg Omen, and what does it actually represent?
Today, we're looking at a broad market indicator created years ago by Jim Miekka, and it essentially looks for conditions that are very common at major market tops. Does a valid signal guarantee a major market top? Of course not. But going back through market history, very few major peaks have occurred without the Hindenburg Omen dropping a bearish signal just beforehand.
You can break the Hindenburg Omen down into three components: a bullish market trend, an expansion in new highs AND new lows, and a bearish rotation in breadth. Let's review each of these components in turn.
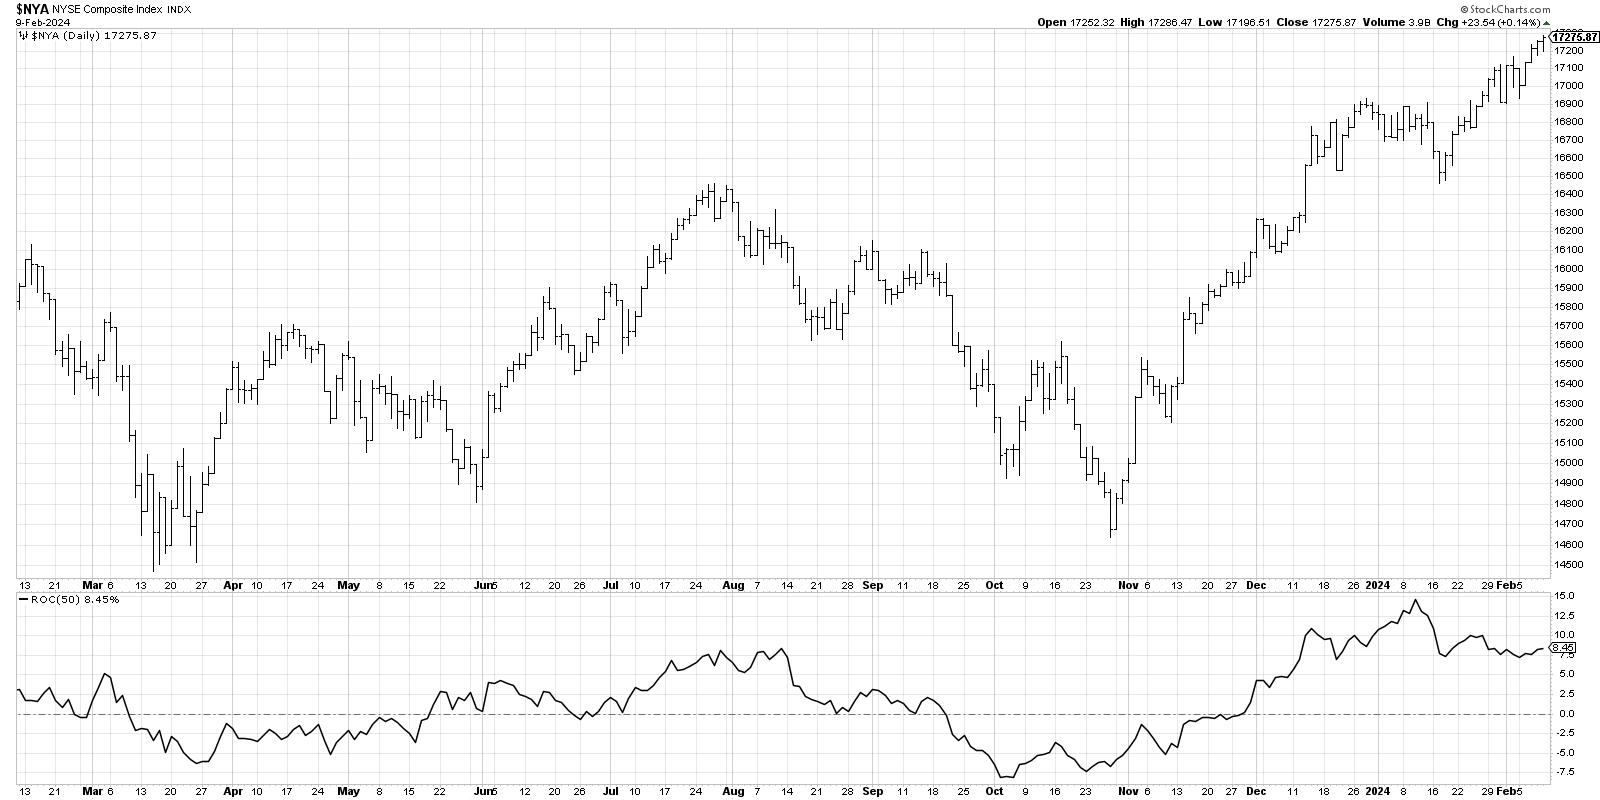
First, we need to confirm that the market is in an established uptrend, as this is an indicator designed to identify market tops. So we take a chart of the NYSE Composite index ($NYA) and look to make sure that the 50-day rate of change (ROC) is positive -- i.e., the market is higher than it was ten weeks ago. If so, then the first condition is met.
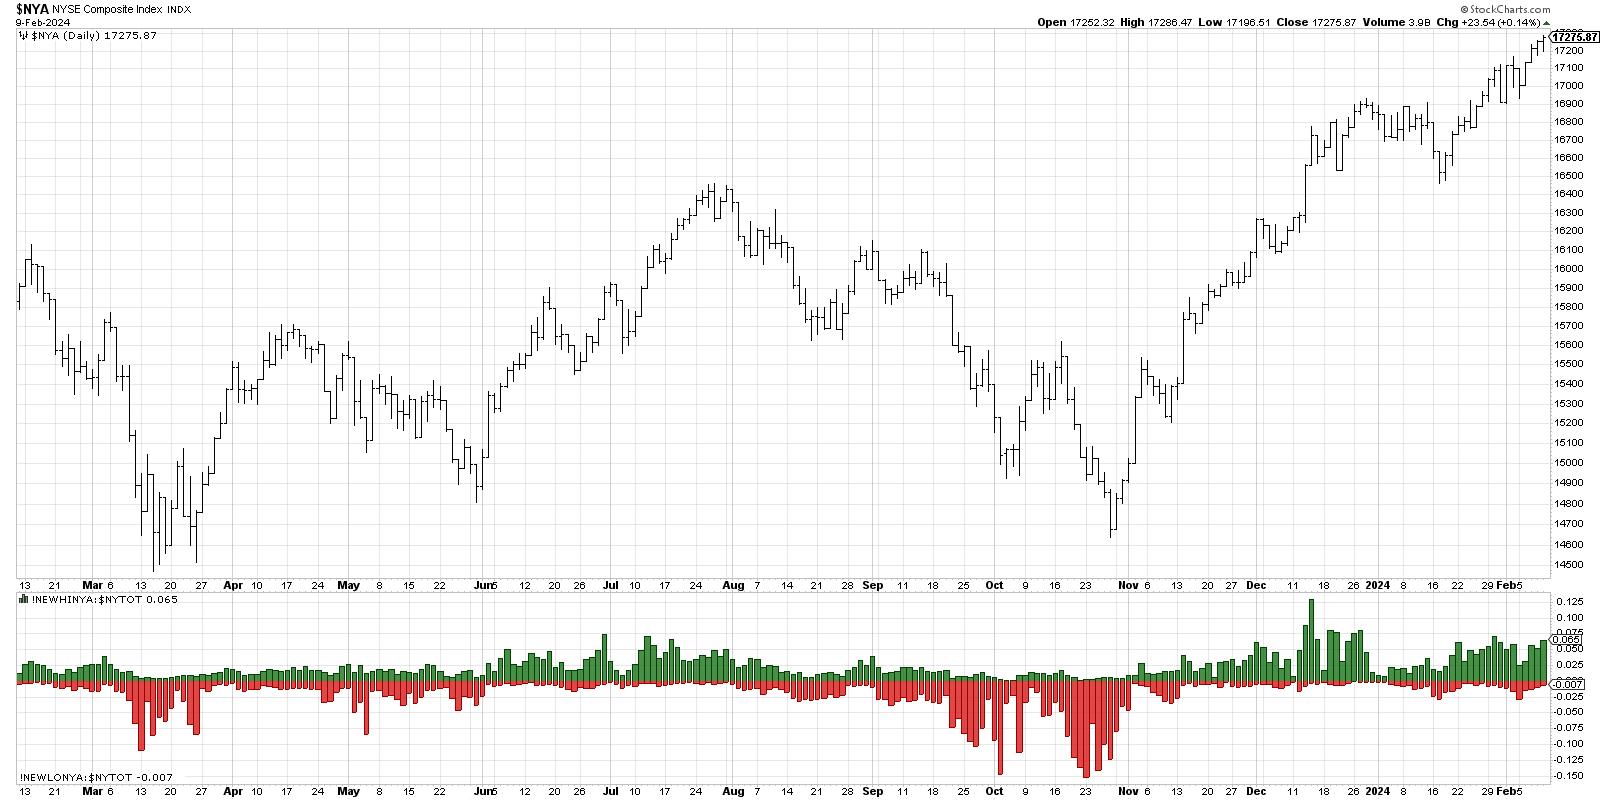
Next, Miekka noticed that, at major market tops, there were not only plenty of stocks making new 52-week highs, but also a bunch of stocks making new 52-week lows. This implied a period of indecision, as stocks were both breaking out and breaking down around the same time. Technically, we're looking for at least 2.8% of NYSE listings making a new high and 2.8% making a new low on the same day. This provides the second condition of the three.
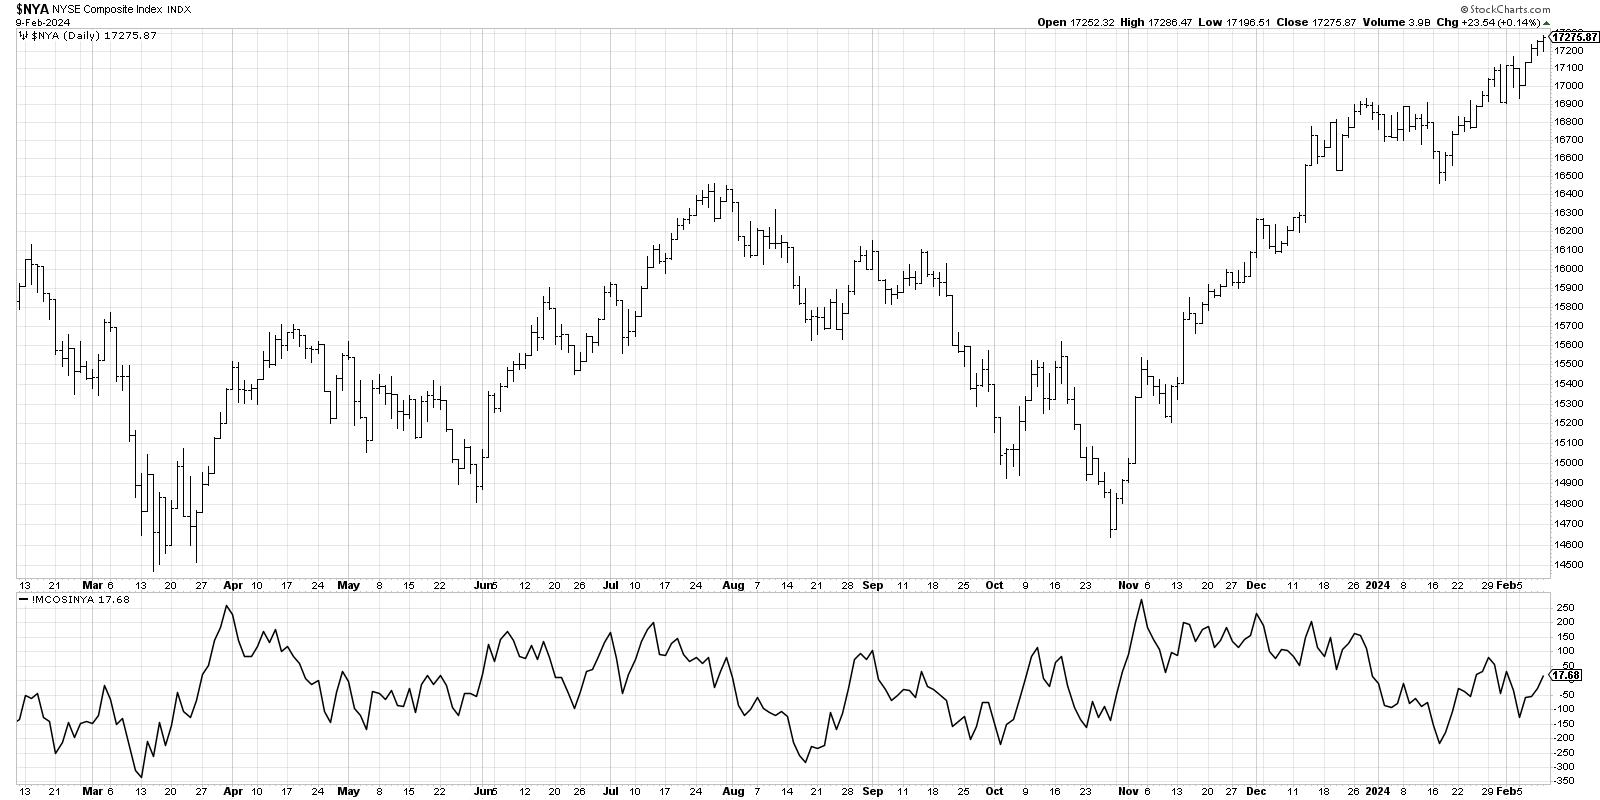
Finally, we're looking for a bearish rotation in market breadth, suggesting that the strength that pushed the benchmarks higher in the bullish phase are now starting to dissipate. Here we use the McClellan Oscillator on NYSE data, and, when the indicator breaks below the zero level, it constitutes a negative breadth reading.
When we put all three indicators together, you get a super busy chart like this!
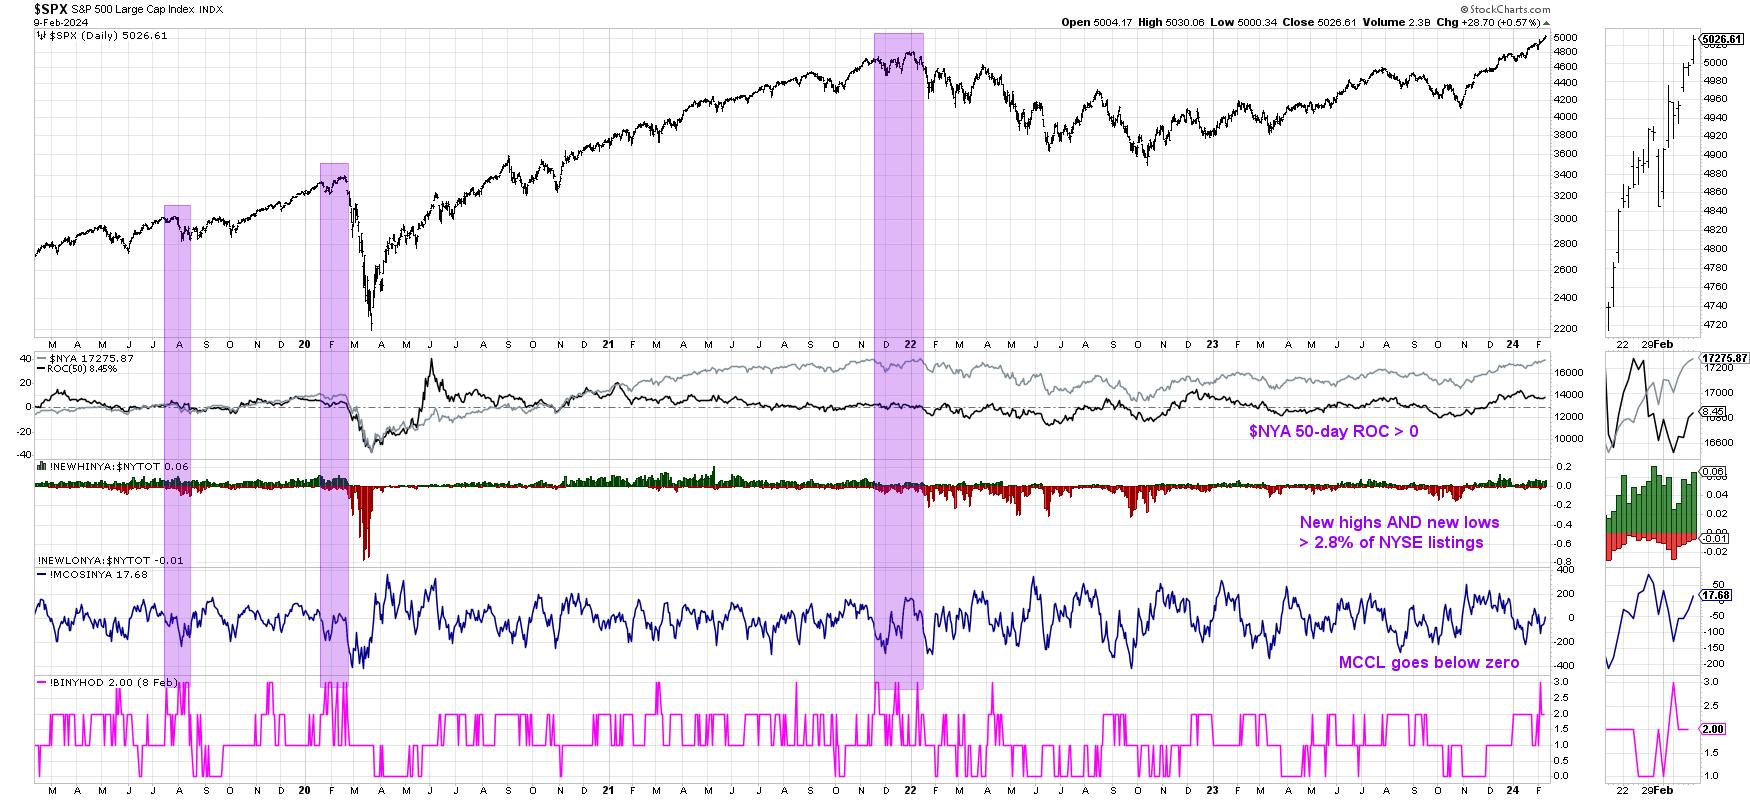
The series at the bottom is a composite indicator that checks for the three conditions above. When all three conditions have been met, the indicator shows a value of +3. It's important to note that just one signal is not enough. You need multiple triggers within a one-month period to complete a valid Hindenburg Omen signal.
In recent market history, we've seen three valid signals: August 2019, February 2020, and December 2021. Two of those signals occurred before significant drawdowns, which is why the initial signal we noted this week has us a bit skeptical of further market upside today. If we do see a confirmed Hindenburg Omen signal with another confluence of triggers over the next couple weeks, then we may be just peering over the precipice of a major market decline.
Indicators like the Hindenburg Omen don't signal often, and they are certainly not 100% accurate at calling major market tops. But mindful investors know to pay attention when conditions look similar to previous market tops. Remember, all large losses begin as small losses!
RR#6,
Dave
P.S. Ready to upgrade your investment process? Check out my free behavioral investing course!
David Keller, CMT
Chief Market Strategist
StockCharts.com
Disclaimer: This blog is for educational purposes only and should not be construed as financial advice. The ideas and strategies should never be used without first assessing your own personal and financial situation, or without consulting a financial professional.
The author does not have a position in mentioned securities at the time of publication. Any opinions expressed herein are solely those of the author and do not in any way represent the views or opinions of any other person or entity.


