There's no denying the strength the major averages have displayed off their April lows. The S&P 500 finished the week within a rounding error of the previous all-time high around 5250. What would it take for the SPX and NDX to power to new all-time highs in May?
Today, we'll break down three market breadth indicators that we are watching to confirm the likelihood of a further rise for the equity indexes. We're also watching those same three charts for warning signs of a trend exhaustion! First, let's measure how many stocks are above key moving averages.
Percent of Stocks Above the 50- and 200-Day Moving Averages
One of my favorite breadth indicators looks at how the members of a particular index are trading relative to their 50-day and 200-day moving averages. During an uptrend phase, a stock tends to be moving higher above two upward-sloping moving averages. By making this simple comparison across a large number of names, we can determine whether a market move is more of a narrow or a broad advance.
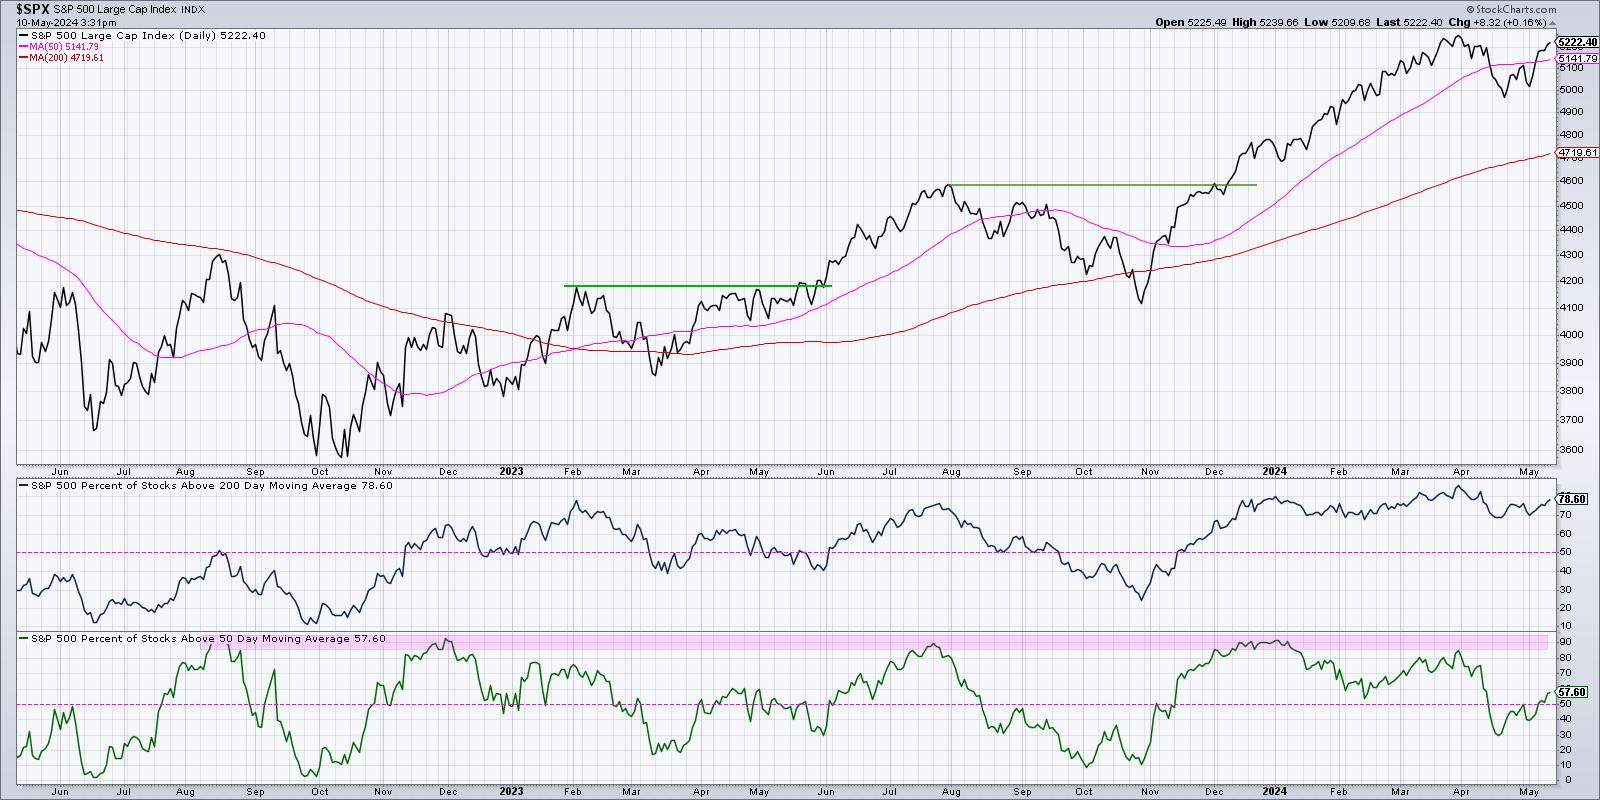
The bottom panel shows that at the end of 2023, about 90% of the S&P 500 members were trading above their 200-day moving average. By the mid-April market low, that number had gone down to around 30%. That suggests that about 60% of the S&P 500 members had broken down through their 50-day moving average in early 2024. Talk about a broad market decline!
Since the April low, this indicator has popped back over 50% to reach almost 60% this week. I've generally observed values over 50% are bullish, meaning that most SPX members are in a short-term uptrend. Thus, as long as this indicator remains above 50%, conditions are fairly constructive. In terms of danger signs on this chart, I've noticed that when the indicator gets up to around 85-90%, that's usually right around a market top. So, for now, this indicator suggests market strength.
New 52-Week Highs and Lows
Now that we've determined a broad advance off the April lows, what about the leadership names? Are there stocks already achieving a new 52-week high?
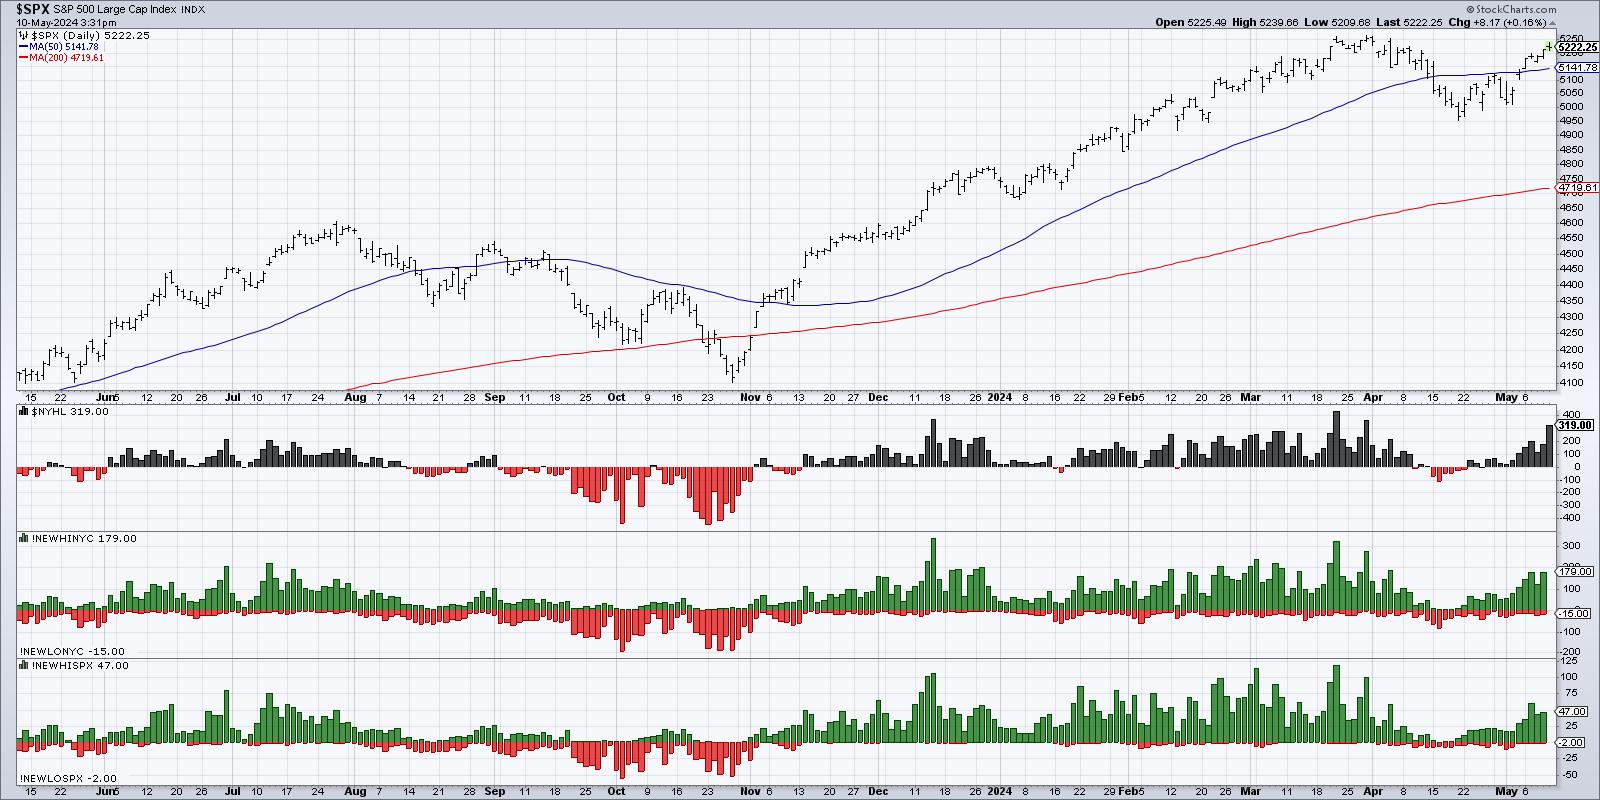
You can see in the bottom panel that, when the S&P 500 had pulled back to around 4950 in mid-April, there were very few 52-week highs (green) or 52-week lows (red) for the S&P 500 members. Most stocks had made a new 52-week high in Q1, and most are still well above their October 2023 lows. But, in the subsequent three weeks, you can see a growing number of new 52-week highs.
So even though the S&P 500 itself has still not achieved a new 52-week high, there are some early leadership names that are already pushing to their own 52-week high. A healthy uptrend is usually marked by an expansion in new 52-week highs. Hence, the more green on this chart going forward, the better.
What would raise a red flag on this second chart? Basically, an evaporation of new 52-week highs would tell you those early leadership stocks are no longer making upward progress, and that, most likely, we are in a new pullback phase.
Nasdaq 100 Bullish Percent Index
The Bullish Percent Index is a market breadth indicator constructed by analyzing point & figure charts for a particular universe -- in this case, the Nasdaq 100 members. What percent of those stocks have most recently given a buy signal on their own point & figure charts?
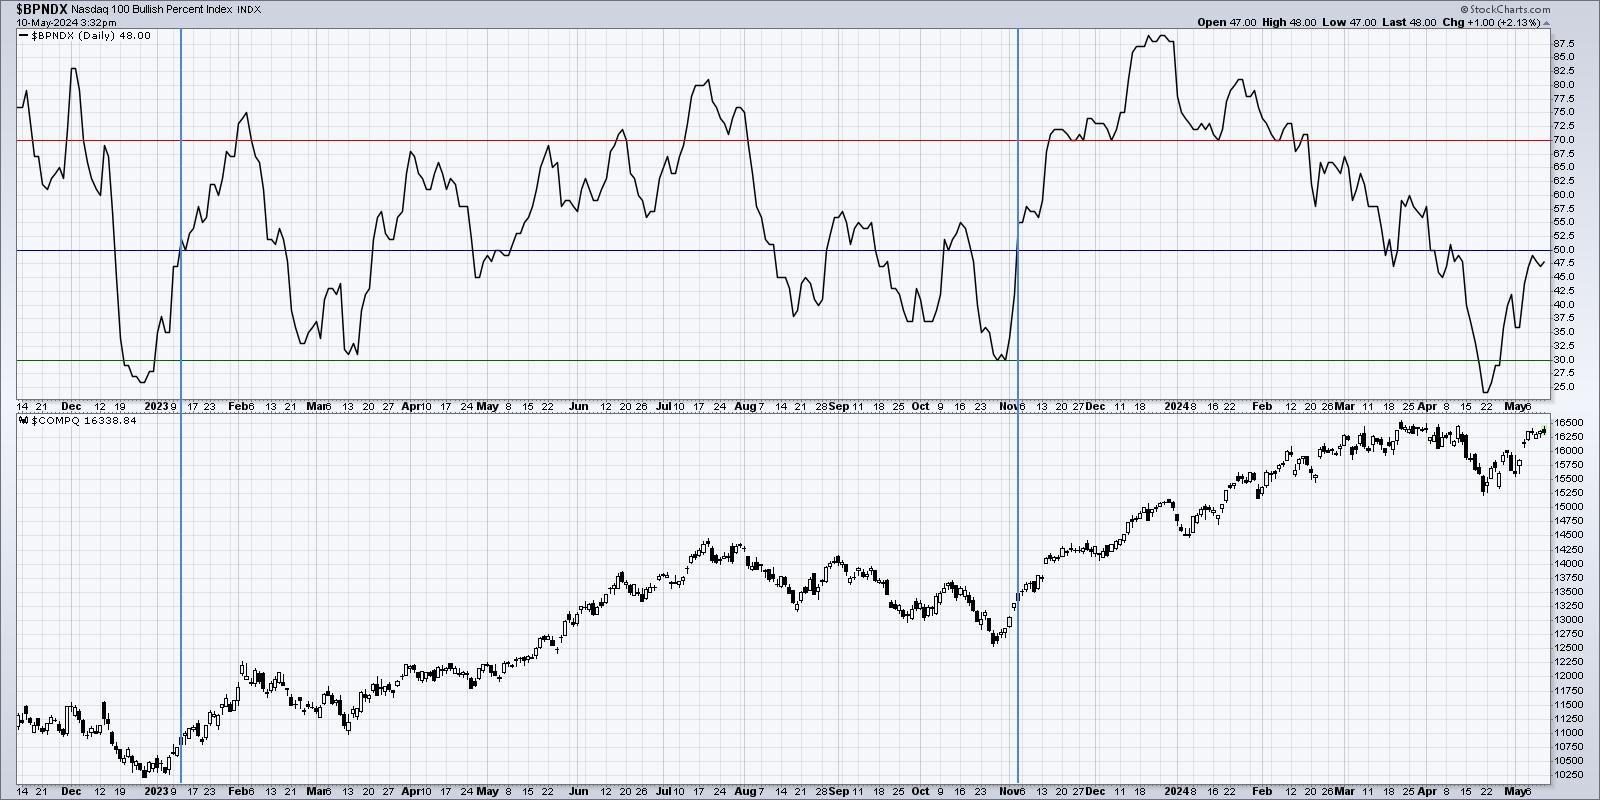
The top panel shows the Nasdaq 100 Bullish Percent Index, which is getting very near to the 50% level. I have found that when the indicator dips below 30%, but then pushes back above 50%, this often serves as a strong buy signal and suggests further upside. You can see the most recent signals in January 2023 and November 2023 demonstrate this phenomenon.
So if this indicator pushes above 50% in the month of May, that would suggest that the current uptrend phase may just be getting started. If the indicator fails to push above 50%, that could indicate that this group of leading growth stocks, including pretty much all of the Magnificent 7 stocks, are not showing enough upside momentum to confirm the uptrend.
Do you think the S&P 500 will achieve a new all-time high above 5250 in May 2024? Watch the video below, then drop a comment and let me know!
RR#6,
Dave
P.S. Ready to upgrade your investment process? Check out my free behavioral investing course!
David Keller, CMT
Chief Market Strategist
StockCharts.com
Disclaimer: This blog is for educational purposes only and should not be construed as financial advice. The ideas and strategies should never be used without first assessing your own personal and financial situation, or without consulting a financial professional.
The author does not have a position in mentioned securities at the time of publication. Any opinions expressed herein are solely those of the author and do not in any way represent the views or opinions of any other person or entity.


