There is no denying the strength of the bullish primary trend for stocks off the April low. The Nasdaq 100 index continues to make new all-time highs, closing just under $480 on Friday after gaining about 3.5% over the last week. But will this incredible uptrend continue into July and August?
We've been tracking plenty of warning signs, from the dramatic increase in bearish momentum signals to an initial signal from the Hindenburg Omen in late May. But, despite those bearish implications, the strength of mega-cap growth stocks, like Nvidia (NVDA) and Apple (AAPL), has been enough to drive the major equity benchmarks higher. The question for investors is whether the strength in these leading growth stocks will be enough to keep this bullish market trend in place!
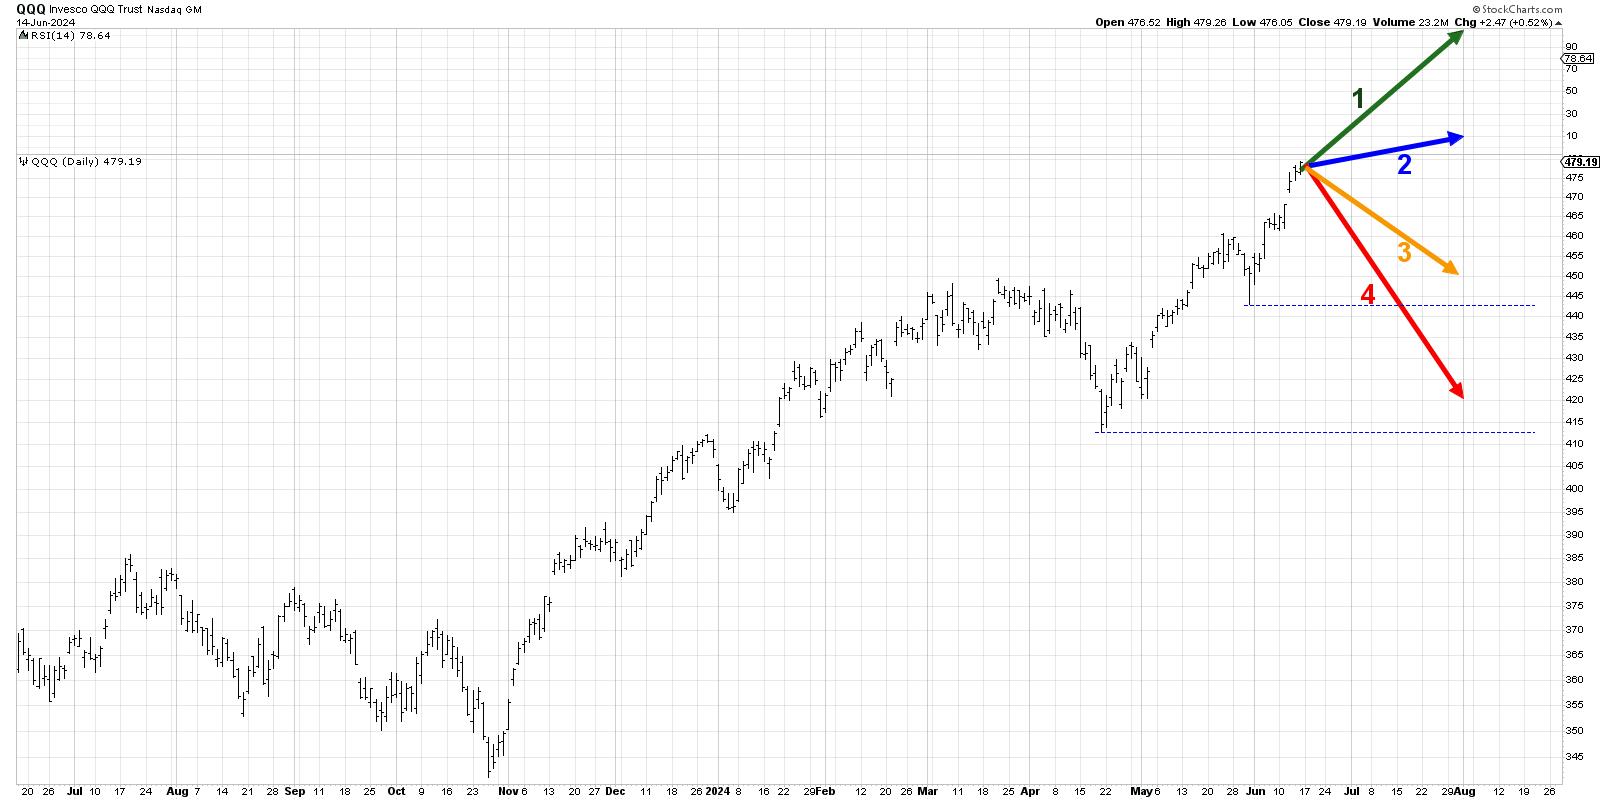
Today, we'll lay out four potential outcomes for the Nasdaq 100. As I share each of these four future paths, I'll describe the market conditions that would likely be involved, and I'll also share my estimated probability for each scenario.
By the way, we conducted a similar exercise for the Nasdaq 100 back in February, and you won't believe which scenario actually played out!
And remember, the point of this exercise is threefold:
- Consider all four potential future paths for the index, think about what would cause each scenario to unfold in terms of the macro drivers, and review what signals/patterns/indicators would confirm the scenario.
- Decide which scenario you feel is most likely, and why you think that's the case. Don't forget to drop me a comment and let me know your vote!
- Think about how each of the four scenarios would impact your current portfolio. How would you manage risk in each case? How and when would you take action to adapt to this new reality?
Let's start with the most optimistic scenario, involving the QQQ pushing above $500 over the next six-to-eight weeks.
Option 1: The Very Bullish Scenario
The most optimistic scenario would mean the Nasdaq 100 continues its incredible pace, pushing well above the $500 level by the end of July. Not only would leading growth names continue to thrive in this environment, but other stocks that have not been participating - such as Energy and Industrials - would likely rotate higher as a broader advance propels the QQQ to further new all-time highs.
Dave's Vote: 10%
Option 2: The Mildly Bullish Scenario
What if the market remains elevated, but the pace slows way down? This second scenario would mean that the Magnificent 7 stocks would stall a bit, and perhaps other stocks would rotate higher. The major benchmarks would remain in a primary uptrend, but we'd be talking about leadership rotation as the market remains in a "wait and see" mode about potential Fed rate cuts later in 2024.
Dave's vote: 25%
Option 3: The Mildly Bearish Scenario
Both of the bearish scenarios would involve a pullback in leading growth names, and if leading names like NVDA begin to retrace their gains from early 2024, we could face a mildly bearish scenario. Breadth conditions remain weak and, after the leaders start to fail, there's nowhere to go but lower. In scenario #3, I would expect the May low around $443 to hold for the QQQ, and this begins to feel like a well-deserved pullback while the primary uptrend still remains in place.
Dave's vote: 60%
Option 4: The Super Bearish Scenario
You always need to have a super bearish outcome, which helps to put the other three into proper perspective. In scenario 4, the leadership stocks give back their recent gains, and perhaps some strong economic data brings the whole "Fed Goldilocks scenario" into question. The QQQ drops below its May low, and by late July we're debating whether the April low will hold. While the major equity benchmarks still have positive returns in 2024, this corrective move forces even the most optimistic of bulls to reconsider their thesis.
Dave's vote: 5%
What probabilities would you assign to each of these four scenarios? Check out the video below, and then drop a comment with which scenario you select and why!
RR#6,
Dave
P.S. Ready to upgrade your investment process? Check out my free behavioral investing course!
David Keller, CMT
Chief Market Strategist
StockCharts.com
Disclaimer: This blog is for educational purposes only and should not be construed as financial advice. The ideas and strategies should never be used without first assessing your own personal and financial situation, or without consulting a financial professional.
The author does not have a position in mentioned securities at the time of publication. Any opinions expressed herein are solely those of the author and do not in any way represent the views or opinions of any other person or entity.


