Many are calling the recent market activity similar to the Great Depression of the 1930s. And clearly, there are some comparisons.
But what did not exist in the 1930's was this level of QE.
During 1932, with congressional support, the Fed purchased approximately $1 billion in Treasury securities. Now that the Fed has bought up debt to an unprecedented level and the government is spending trillions on stimulus, a depression is not out of the question.
I will show you (and I believe this is completely original and unique content) that there is a better comparison though, that being to the mid-70s.
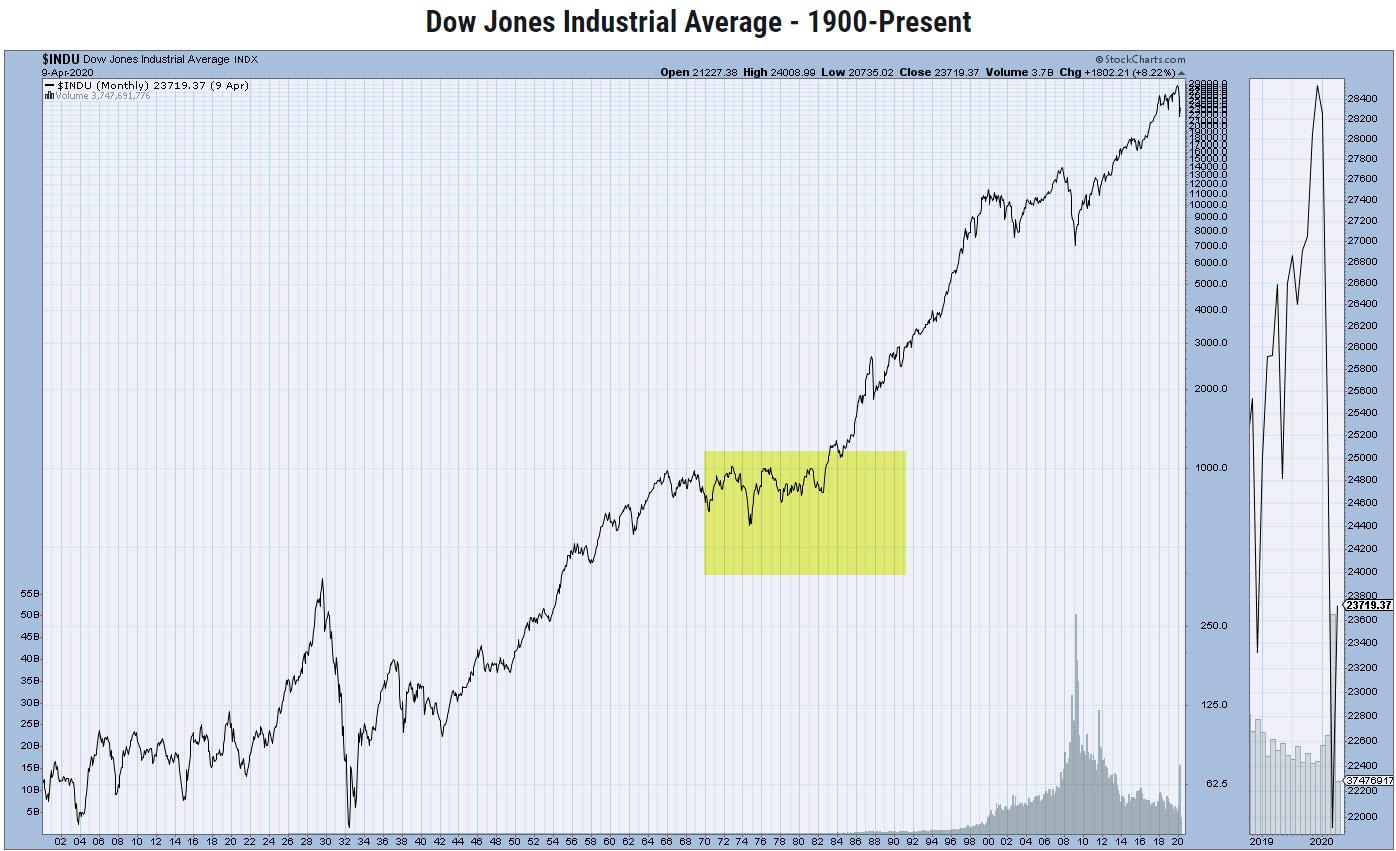
In the chart of the DJIA, you can see the Depression, where it hit a nadir in 1932 before roaring back. From 1954 (when the pre-depression highs were taken out) until 1970, the market enjoyed a huge run from 200 to 1000 in the DJIA.
Then, the first crisis hit with the Yom Kippur wars. Next came the oil embargo, when OPEC formed and tripled oil prices. Gas lines and oil prices spiked. We have a different type of oil crisis now - that being that nobody using it and there is an oversupply.
The DJIA dropped from a peak in 1971-72, at 1000, to 577.60 in 1974. It took nearly 10 years for the market to return over 1000.
In 1972, oil was priced at around $22 per barrel. Now, in 2020, with oil trading around those 1970 lows, what happens once the demand returns? Throughout the last 60 years, every time oil has gotten down to around 20, something dramatic has happened to raise oil prices.
In my latest StockCharts TV video, I show you how oil, gold, the bonds, government spending, the dollar, GDP, unemployment, agricutural prices and CPI all play a part in the comparison.
- S&P 500 (SPY): 287-290.45 (retrace to the MA breakdown)
- Russell 2000 (IWM): 114.55 support 118-120 pivotal. 125.80 2018 November low resistance
- Dow (DIA): 240 pivotal
- Nasdaq (QQQ): 205 support. 220 big resistance
- KRE (Regional Banks): 33.10 pivotal support
- SMH (Semiconductors): Confirmed Bullish phase, 128 support to hold
- IYT (Transportation): Really needs to clear 150 to get interesting
- IBB (Biotechnology): 120 pivotal support
- XRT (Retail): 31.00 support, 36-38 resistance
- Volatility Index (VXX) 35 the 50-DMA
- Junk Bonds (JNK): 100.66 the 50-DMA.
- LQD (iShs iBoxx High yield Bonds): Inside week. 129.10-132 range to watch break. 135 resistance
Mish Schneider
MarketGauge.com
Director of Trading Research and Education


