Last Friday, I made a video for my show on StockCharts TV (watch here) that began with a comparison of oil in the early-to-late 1970's period against what we're seeing now.
With oil crashing to pre-WWII levels, the analogy is that super cheap oil has preceded a war several times over the last 90 years. If the words "pre-WWII" don't resonate with you, how about the Yom Kippur Wars of 1973 (featured in the video)? Or the Persian Gulf War 1990, or the Iraq War of 2003?
As crazy as it may sound to you all now, I would not dismiss some major disruption to mitigate the glut.
After all, global economies, many US states and certainly millions of folks, depend on oil money to live. Furthermore, tensions everywhere are already high. Protesters worldwide want to get back to work. In the face of the pandemic, feeding a family becomes more worrisome than illness.
So, looking at the ratio charts, what can we take away?
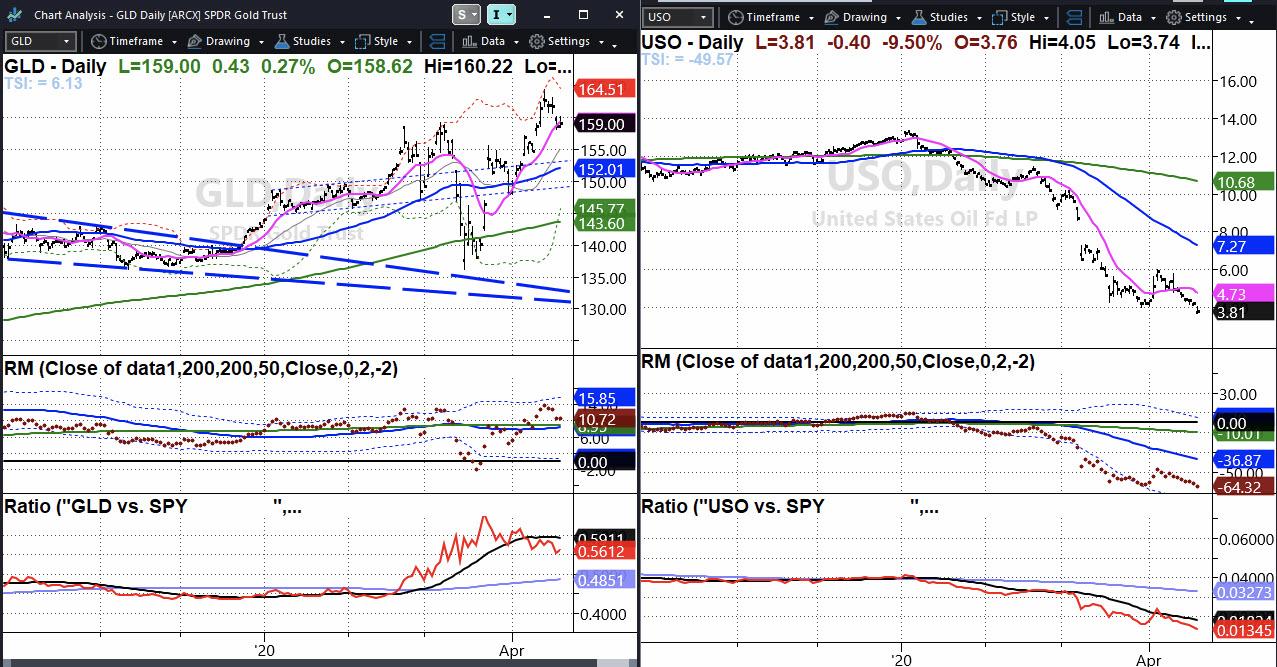
The chart on the left is the GLD daily chart, along with the momentum indicator and GLD vs. SPY ratio chart. Gold (GLD) closed above the pink line, or short-term moving average. The trend is bullish, and I believe it will remain that way, as per my video.
The middle chart is our Real Motion momentum chart. GLD has cleared the moving averages, and the price lines up with the waning momentum. That tells us that, once momentum returns, up GLD goes.
The bottom chart is the ratio between GLD and SPY. SPY began to outperform GLD, which means another gauge is to see if that ratio flips back in favor of gold.
On the right is the US Oil Fund (USO) Daily chart. Because it did not clear 6.00, we stayed away. Good thing too. The spot price of oil went negative (-$10 per barrel) as the May contract expired.
USO crashed by over 11% with an insane amount of volume traded. Average daily volume is around 117 million shares. Today's volume was 727 million shares. Blow off? We shall see.
The Real Motion data shows the declining momentum. We will be watching for any disparity, or when oil begins to stabilize or increase in momentum before the price does.
The ratio chart vs. SPY - again, no surprise there. USO is well underperforming SPY. Should that level out, we will have yet another good indication.
Finally, watch the geopolitics around the world and the US. History, even for unprecedented events, does repeat itself. Perhaps not with the same script, but human nature is human nature.
- S&P 500 (SPY): Ran right to resistance at under 288 and fell today. Support at 278-280 to be tested
- Russell 2000 (IWM): 114.55 support, 118-120 pivotal. 125.80 2018 November low resistance
- Dow (DIA): 240 pivotal, 234.80 support to hold
- Nasdaq (QQQ): Inside day. 212.08-21651 range to break. 205 support, 220 big resistance
- KRE (Regional Banks): 33.10 pivotal support to hold, 35 resistance
- SMH (Semiconductors): 3 moving averages converge at 127.25 area
- IYT (Transportation): 139.69 last week's low
- IBB (Biotechnology): Highest price since 2015. 123.75 last swing high in 2019
- XRT (Retail): 31.00 support to hold, 36-38 resistance
- Volatility Index (VXX): Never broke the bullish phase. 45.00 next resistance
- Junk Bonds (JNK): 100.43 the 50-DMA. 98.20 support to hold
- LQD (iShs iBoxx High yield Bonds): 128.70 the 10-DMA support to hold
Mish Schneider
MarketGauge.com
Director of Trading Research and Education


