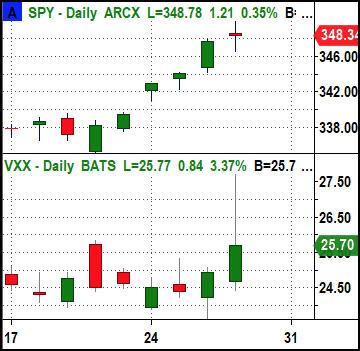
Today, while the SPY and QQQ were pushing to new highs, the VXX was telling a dramatically different story, which is a warning sign for a potential imminent correction.
The VIXX (Volatility Index ETF) is commonly referred to as a fear gauge, so it naturally tends to go up when the SPY goes down. Likewise, when the SPY is trending higher, the VXX trends lower. It's not common for the SPY to trend higher for days and have the VXX also move higher.
The closing low in the VXX for the current move occurred 8 days ago!
Some of the reluctance of the VXX to mover lower could be a result of the market hedging against the uncertainty of the reaction to today's speech by Fed Chair Powell. However, today's most bearish message from the VXX came AFTER the speech had concluded.
The daily chart below shows the SPY on top and the VXX underneath:
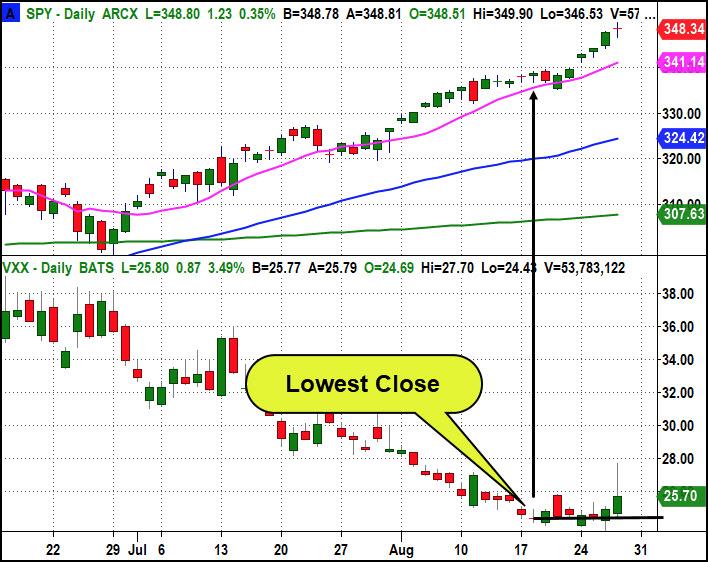
As I've said, the VXX's reluctance to fall while the SPY has rallied with such conviction represents two very different opinions among market participants. SPY holders are bullish, while VXX holders are bearish. When this happens (and usually in a much smaller way), the market often corrects.
What's even more alarming is the extent to which the VXX rallied today.
Additionally, the intraday pattern is one you may want to memorize if you like timing short-term tops. The pattern intraday is also the same idea that plays out on the larger daily timeframe.
The chart below is the 5-minute chart of today, with the 30-minute Opening Range (OR) on the SPY and VXX. The 30-minute opening range is a powerful tactic for anticipating many different moves in all markets. In this case, I'm using it to identify the diverging price action that warned of a coming selloff in stocks.
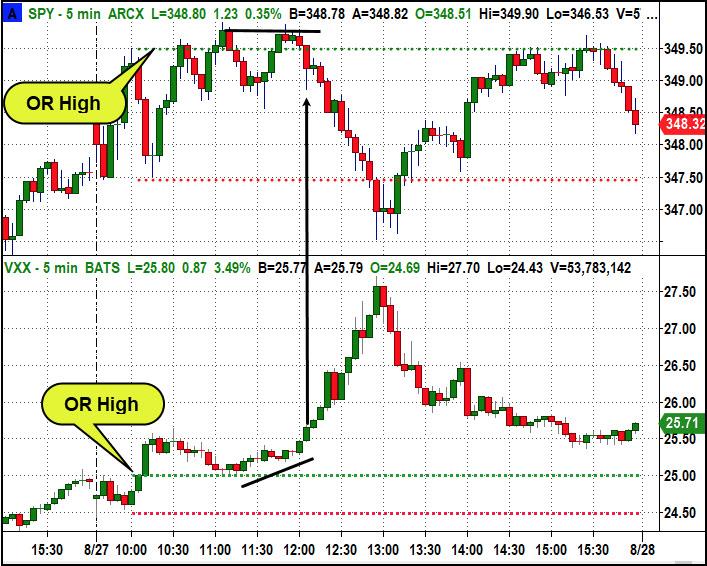
Here's the series of events that the OR trader sees happening.
- Shortly after 10:00, the SPY tests its OR low and holds. At the same time, VXX (expectedly) rallies to its OR high. However, the VXX didn't reverse; it broke out.
- The SPY rallies to its OR high and continuously tries to break out. This action should be accompanied by a VXX at its OR low trying to break down. As you can see, the complete opposite was happening; the VXX was holding the support of its OR high! Furthermore, at about 11:30 as the SPY was at its high of the day, the VXX began to rally!
- When the SPY came back into its OR (a pattern we call an OR reversal), the VXX was breaking out to new highs for the day. This is very bearish for stocks, and therefore it's no surprise that stocks fell to their lows.
The sequence of events is not highly unusual, but what is very unusual is how dramatically the VXX rallied on such a small decline in the stocks.
The VXX's move today tells a story of a very nervous market, and I'm highlighting this as a red flag for the current market because the pattern you see in today's intraday chart is still developing on the bigger daily chart time frame.
The SPY made several new intraday highs as the VXX had diverging action today before it sold off. The time to be concerned is when the SPY breaks an important inflection point. The inflection points to watch for intraday moves are the OR levels. The inflection points for a bigger move in the daily charts is the prior day's low.
In short, the daily chart "red flag warning" that the VXX is flashing right now tells me to be very cautious when intraday pattern like the one above occurs, and to be even more concerned if the SPY trades below the low of the prior day. When you put them together, you may be pleasantly surprised at how well you can anticipate unpleasant market turning points.
Feel free to ask questions or leave comments in the comments box below.
Best wishes for your trading,
Geoff Bysshe
President, MarketGauge.com
(Geoff is filling for Mish until August 31st.)
Note: PDL = Prior day low, PDH = Prior day high
- S&P 500 (SPY): Doji. 340, then 335 are important support
- Russell 2000 (IWM): Weak consolidation day. Key area to break is 157, then 160 is resistance area. Support at 155 then swing low is 153.60
- Dow (DIA): Resistance at 290. Support at 280
- Nasdaq (QQQ): Be careful below today's low. 275 is pivotal support area. 260 is key support level and a trendline
- TLT (iShares 20+ Year Treasuries): Ugly breakdown. Resistance at 163. Support at 158.50 then the 200 DMA at 155.80