The weekend is the time to step back and look at the Modern Family's weekly trends and inflection points. This week, there are several interesting multi-timeframe patterns developing on the daily and weekly charts; some bullish, others bearish.
Before jumping into the charts, let me remind you about last Monday's article, in which I highlighted that since the March low, the SPY, QQQ, DIA and IWM have closed higher on Mondays more than any other day of the week.
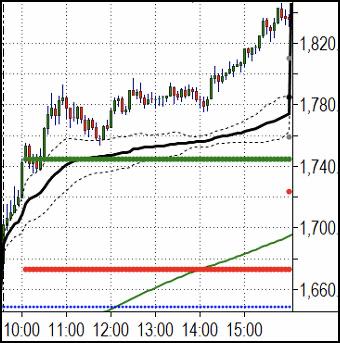
In addition to the odds of Monday closing higher, I'll be looking at the intraday trends of two stocks on Monday to assess the mood of the market. These two stocks will almost certainly be the headline de jour, and the direction they take relative to their Opening Range could serve as a good indicator for the market's intraday trend for the day.
The two stocks are APPL and TSLA. On Monday, their stock splits take effect. Their prices will be lowered, and additional shares issued accordingly. Both stocks have run up enormously since they announced the split on expectations that lower post-stock split prices will attract new buyers and drive the share prices higher.
I don't have a prediction about whether the actual split will induce even more buying or mark a prominent day that will be later be described as, "buy the news, sell the split." However, I do have a plan to trade them and use them as a market indicator.
If they're below their Opening Range (OR), stay away, and if the market is doing the same thing, be cautious. If they're above their OR, look for the potential of a big trend day.
Now, let's take a look at the Modern Family's big trend developments.
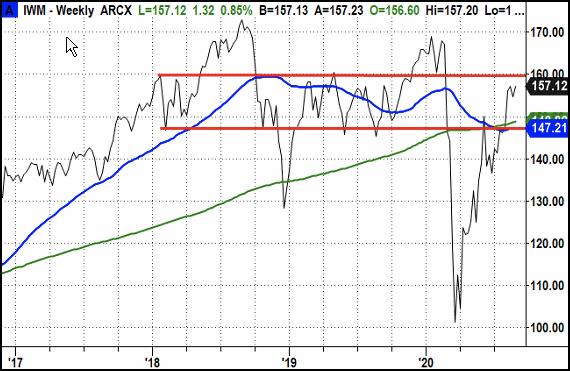
Starting with Grandpa Russell (IWM), it's worth noting that, on Friday, it rallied into late in the day to close above 4 days of consolidation, over the 10-DMA and with the highest close of its COVID-19 comeback rally. Looking at the weekly chart below, we can see that the big level for it to clear is 160.
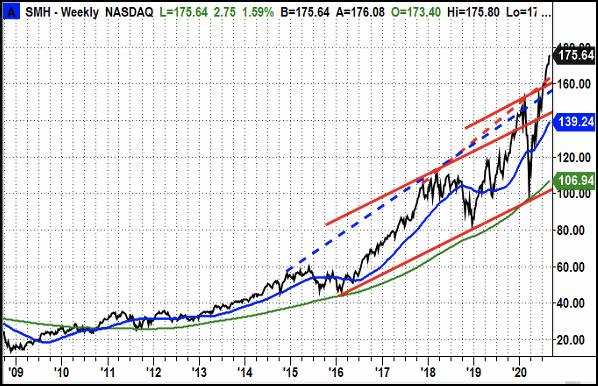
One of the stronger members of the semiconductor (SMH) had pushed into some pretty high levels relative to its past. The solid red lines are a lower trend line its parallel resistance channels.
The dotted blue line is a resistance line based on the highs from before prior corrections. SMH exceeded this line marginally before the 2020 top. The dotted red line is the same resistance line for the current rally, and again SMH has extended through it.
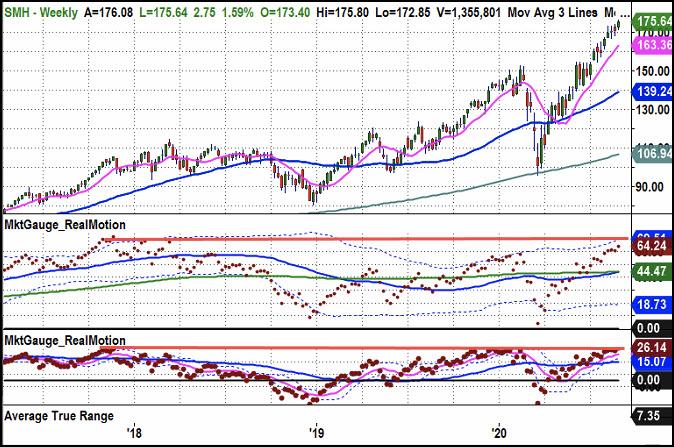
Since it's seemingly quite extended, let's look at a weekly view of SMH with our Real Motion indicators. These measure momentum with several types of patterns that anticipate turning points and confirm trends.
The red lines on the two Real Motion charts demonstrate that SMH is at or near momentum levels that occurred at significant highs in 2017, 2018 and 2020. These measures are very long-term, and I would not suggest a turning point is imminent based on them. However, they do suggest that, if SMH begins to retreat, it has plenty of room and reasons to fall.
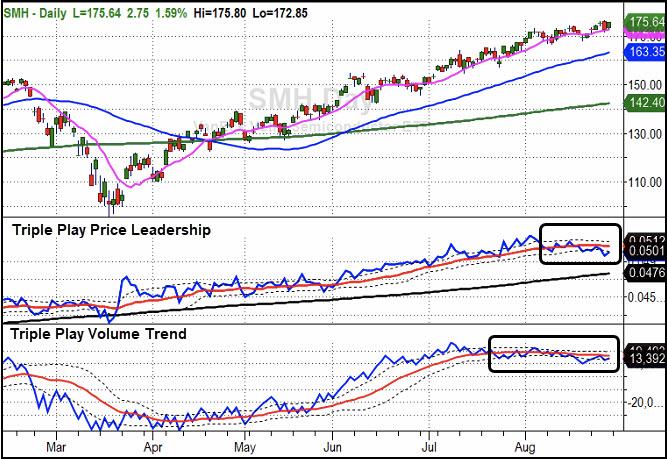
With weekly Real Motion stretched on two time frames, let's look below at our Triple Play indicators, which measure price leadership and volume trends on a daily chart.
Simply put, when the Triple Play blue line is under the red line, it's bearish. The black boxes highlight the bearish divergence that has persisted in August as SMH has rallied while its underlying trend and volume strength has weakened.
This divergence can persist for some time, but when the price action of SMH weakens (i.e. breaks the 10-DMA in a meaningful way), this chart will be bearish.
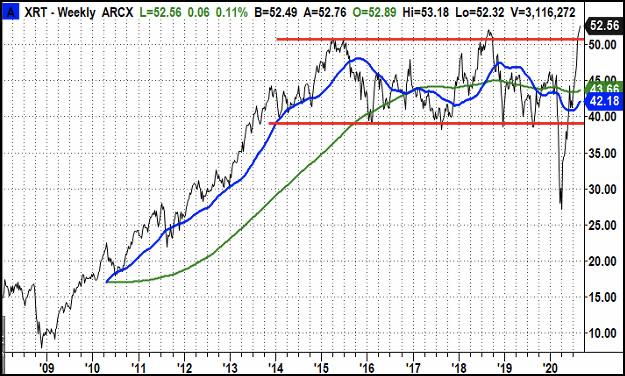
Another Modern Family member that is looking stretched and vulnerable is Retail (XRT), seen below. As I've been highlighting for weeks, it's sitting right over the high of a 5-year range.
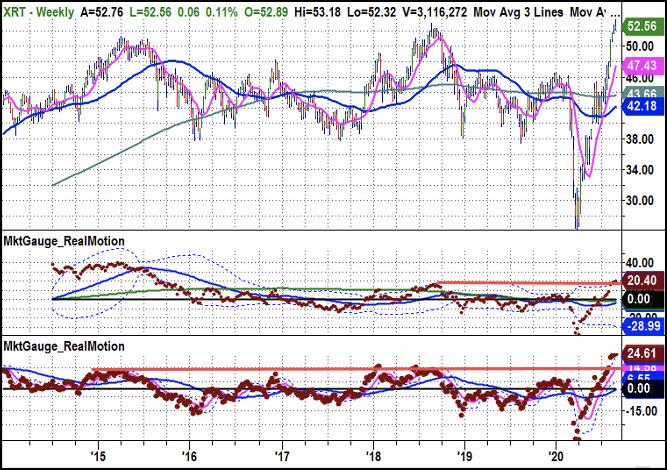
While this breakout may turn out to be bullish, the red lines on its Real Motion chart (below) show that it's at a level that suggesting it could use a rest.
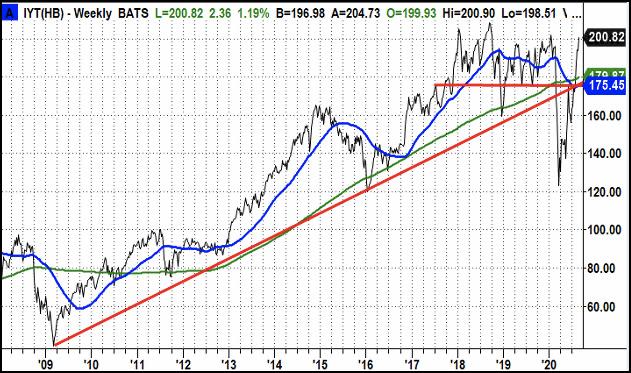
Another member bumping up against long-term resistance is the Transports (IYT). Last week, IYT closed over 200. This never happened in 2019 and only once in 2020. A close over 202.28 would be a bullish sign with bullish Triple Play leadership (not shown here).
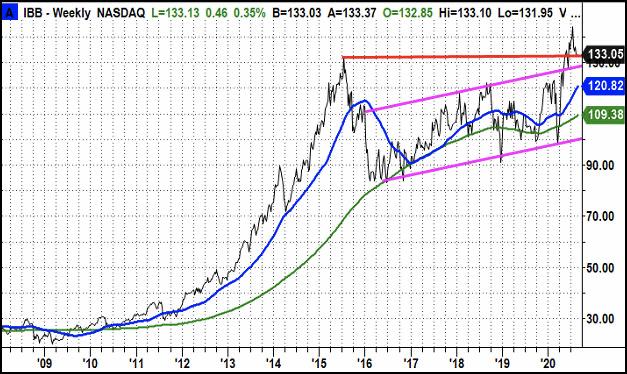
Biotech (IBB) has been lagging on a daily basis, but, as you can see below, it's sitting on a big weekly support level.
With the Fed flooding the system with liquidity, Regional Banks (KRE) are in a tough spot, and the chart seems to reflect it. As the economy improves and generates loan demand, this should be bullish for the banks. Likewise, if it's loan demand that leads to higher rates and a steeper yield curve, this should be even more bullish for the banks. However, if rates rise because of inflation, this is not likely to be bullish for banks, since it's the lender that gets hurt more in an inflationary environment.
The good news for you is that KRE's chart may be a good indicator of just how bullish the general stock market should be, since KRE in an uptrend could reflect confidence in the economy without concerns of damaging inflation.
Keep in mind that KRE could fall for a lot of reasons, so I would not assume weak banks must result in a weak general market, but it's not good either. KRE over 40 would the first big step. Then 45.

If you have any questions or comments, I'd love to hear them in the comments box below.
Best wishes for your trading,
Geoff Bysshe
President, MarketGauge.com
(Geoff is filling for Mish until August 31st.)
Note: PDL = Prior day low, PDH = Prior day high
- S&P 500 (SPY): New high. 340, then 335 are important support.
- Russell 2000 (IWM): Closed over 157. 160 is resistance area. Support at 155, then swing low is 153.60
- Dow (DIA): Resistance at 290. Support at 280.
- Nasdaq (QQQ): Inside day. 275 is pivotal support area. 260 is key support level and a trendline.
- TLT (iShares 20+ Year Treasuries) :Resistance at 163. Support at 158.50, then the 200-DMA at 155.80.