On Wednesday, the Federal Reserve stated that interest rates will continue to stay close to zero, along with a new estimate for the unemployment rate down to 4.5% instead of 5% for the year. Additionally, the GDP estimate was revised to +6.5% from +4.2% for 2021.
Many people were watching to see if the Chairman of the Federal reserve Jerome Powell would signal any efforts to deal with rising inflation. In the announcement, the inflation estimate was also increased from 1.8% to 2.4% for 2021. Considering the average of inflation rate taken from 1913 to 2020 is about 3.10%, these estimates are not very wild.
It looks as though the Federal Reserve is worried more about lowering the unemployment rate and further supporting the economic recovery going forward. However, it should be noted that the Fed does not look at the Food or Energy sectors when calculating inflation, as they both tend to have higher volatility. This is where our special inflation indicator comes in, as we believe both the food and energy sector add a needed layer to the bigger inflation picture.
Specifically, we look at sugar, which is found in most processed foods. From a long-term perspective, its demand can help gauge if inflation is beginning to run hot or not. It is also used in the production of ethanol, as sugar is needed to ferment. Ethanol is an additive to gasoline, so not only does this show the use in food/alcohol, but it also ties into travel and the movement of goods.
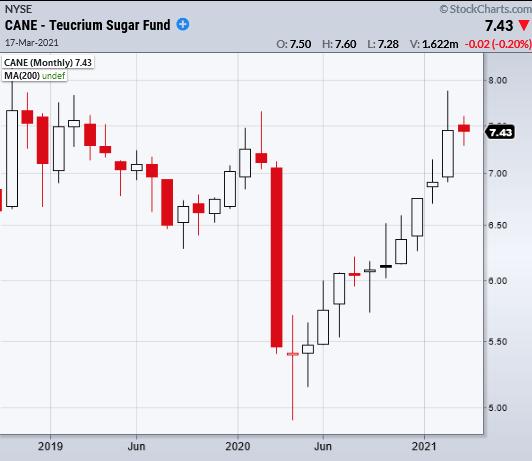
Looking at the monthly chart of Teucrium Sugar Fund ETF (CANE) we can see that since the crash from last year, CANE has made a comeback to pre-pandemic times. If inflation does begin to heat up under the Fed's radar, CANE should see increased demand and continue to move up as the prices of goods begin to increase. So far, CANE has not made any huge moves, but has been able to build a steady uptrend we can watch to continue.
The last thing to keep in mind is that the underlying pressure for the Federal Reserve to deal with rising interest rates will stem from inflation. Therefore, if things get out of hand by the Fed's metrics, at some point they will have to step in. This is news the market does not like, which is why it pays to understand if inflation is beginning to run hot.
- S&P 500 (SPY): Reached new highs. 394 support
- Russell 2000 (IWM): Bounced off 226.33 10-DMA
- Dow (DIA): New Highs. 320 new support.
- Nasdaq (QQQ): Watching for a second close over the 50-DMA at 320.92
- KRE (Regional Banks): 68.41 support area.
- SMH (Semiconductors): Second close over the 50-DMA of 237.55 brings this back into a bullish phase
- IYT (Transportation): 244.88 support from 10-DMA held
- IBB (Biotechnology): Main resistance 160.60 the 50-DMA
- XRT (Retail): 88.49 next support area the 10-DMA
Mish Schneider
MarketGauge.com
Director of Trading Research and Education
Forrest Crist-Ruiz
MarketGauge.com
Assistant Director of Trading Research and Education


