The easy answer to this question is if you do not know what to do, you should probably do nothing. But it gets more complicated if you do not know why you should be doing nothing. No one likes to feel as though they are missing out on profits by not participating. Taking that into mind, here is a way you can look at the major indices and come up with a clear plan of action.
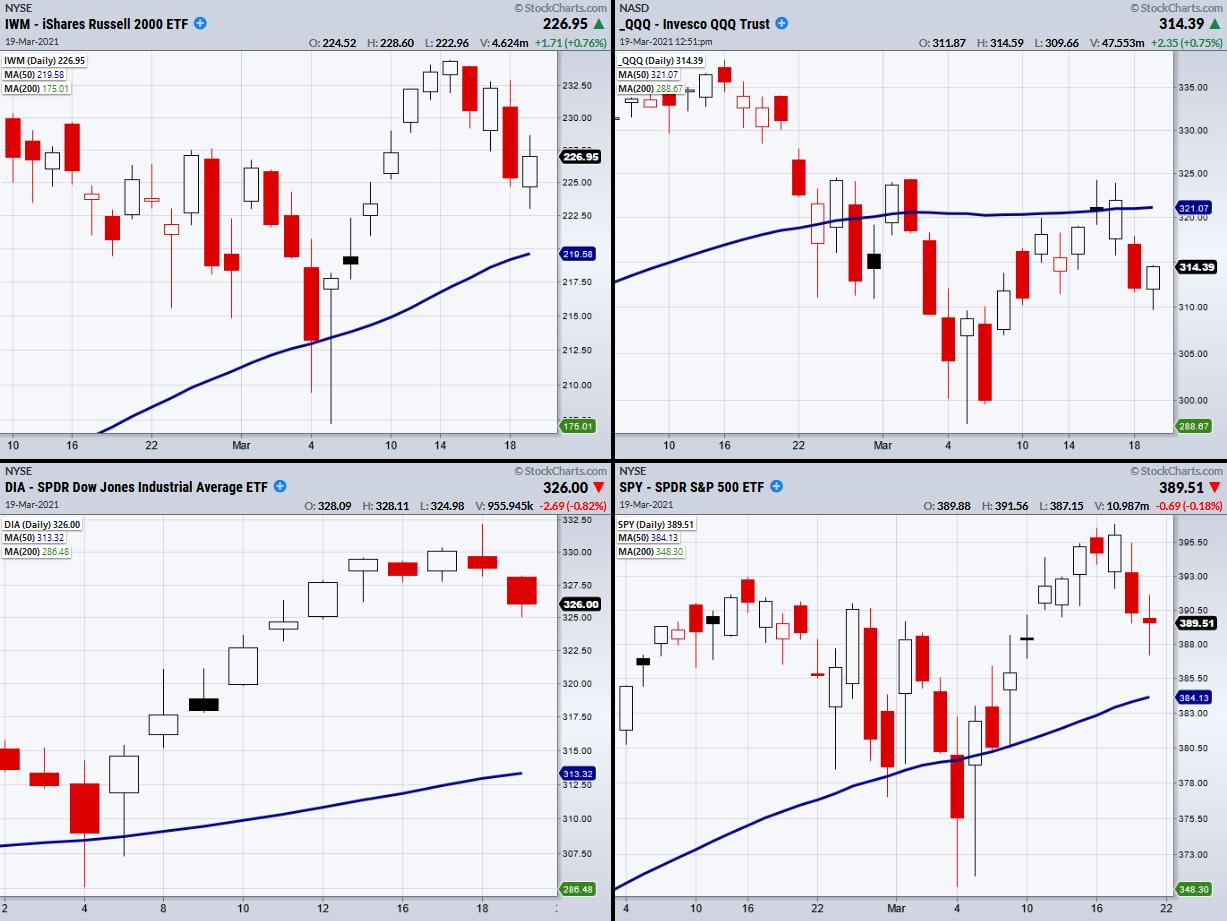
The above daily charts are of the four major indices, including the Russell 2000 (IWM), S&P 500 (SPY), Nasdaq 100 (QQQ) and the Dow Jones (DIA). Simply put, we are trying to figure out what each index is doing and if they are moving together or not. A movement in unison makes it easy to discern the path of least resistance. If they are not moving together, this is equally important as it shows us that the market is confused or choppy.
Currently, the SPY and IWM daily are pulling back towards support of their 50-day moving averages. The DIA, while stronger than the rest, has also pulled back some. Because the DIA is far from its 50-DMA, it would make more sense to watch its nearest support area, around $320. On the other hand, we have the QQQs, which tested the resistance from its 50-DMA and failed to stay over.
One important thing to note is that all the indices' moving averages are sloping upwards and 3 of the 4 are in bullish phases. A bullish phase is when the price is over the 50-DMA and the 50-DMA is over the 200-DMA. Both reasons keep our current market stance bullish.
To boil all this down, we have 3 indices moving together on a pullback, with the fourth (QQQ) recently failing a pivotal point. We have also seen some choppy price action, as both IWM and SPY have flipped back and forth between green and red days last week.
Come Monday, we will keep a bullish bias, but also know the pullback could continue. If the market moves lower, we will watch how the indices behave when they approach their support area. If instead the indices rally back up, we will watch how the QQQs perform near resistance of the 50-DMA and if the other 3 are moving upwards together.
Because of the choppy conditions, if we decide to take any trades, we can reduce our normal trading size and therefore reduce our amount of risk and exposure to the market. With that said, if the indices continue to have divergence, having patience and doing nothing is never a bad choice.
SPACs are the latest craze. In this week's edition of StockCharts TV's Mish's Market Minute, Mish looks at 20 of them with actionable information.
- S&P 500 (SPY): 385.37 next support the 50-DMA
- Russell 2000 (IWM): 219.13 next support area from 50-DMA
- Dow (DIA): Next support 320.
- Nasdaq (QQQ): Watching for this to hold current price level as the next support area is around 300
- KRE (Regional Banks): Closed over 68.41 support area
- SMH (Semiconductors): Needs to clear the 50-DMA at 237.95 and hold
- IYT (Transportation): 245.46 support from recent low
- IBB (Biotechnology): 160.72 resistance. Support 144.30
- XRT (Retail): 85.69 support
Mish Schneider
MarketGauge.com
Director of Trading Research and Education
Forrest Crist-Ruiz
MarketGauge.com
Assistant Director of Trading Research and Education


