Next week, investors are expecting the Fed to announce a reduction in the monthly bond-buying program. Jerome Powell, the Fed chair, has previously stated that he's looking to keep the original tapering schedule. This means there should not be any surprises investors need to worry about.
At least we hope.
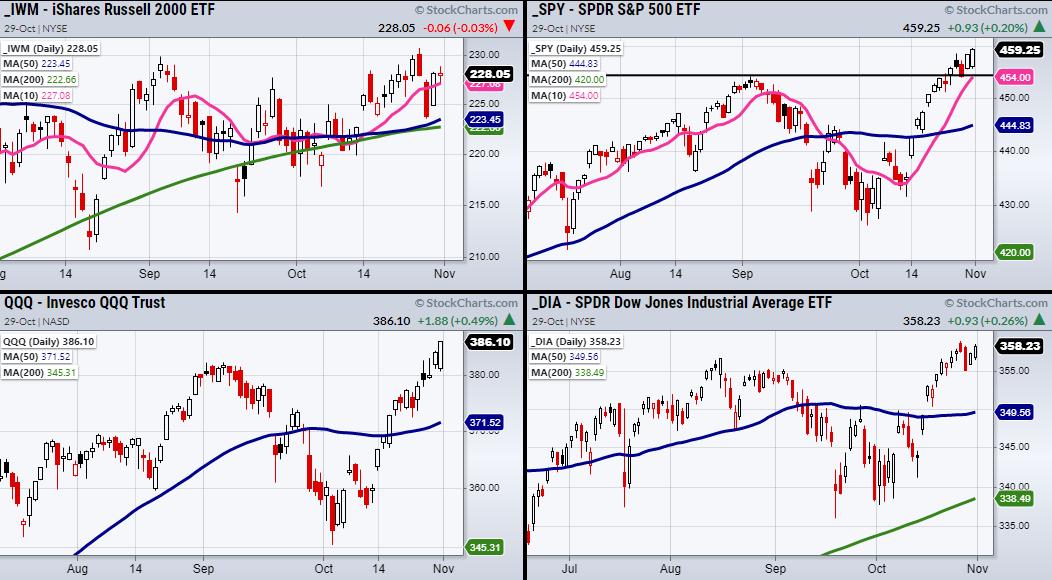
While the media focuses on the upcoming Fed meeting, it has also cast worry on the weak 2% annual growth rate the U.S. economy now faces. However, looking at the major indices, including the S&P 500 (SPY), Nasdaq 100 (QQQ) and the Small-cap index Russell 2000 (IWM), we can see that investors don't seem very worried. Having said that, a recent break to new highs does leave the market in a pivotal area that we need to be cautious of. This is where technical analysis comes in.
Looking at the above charts, the SPY's recent dip to $453.86 created a new support level. This support level also lines up with the breakout to new highs and the 10-day moving average (pink line) as of Friday's close. Though the tech-heavy QQQ does not line up with great support like the SPY, it has made another close over its breakout level at $382.78.
While the QQQ and SPY give us a picture of the large-cap companies, IWM takes the small-cap side. So far, IWM made an unconvincing close over its 10-day moving average. Though it was able to make a rapid recovery from Wednesday's selloff, IWM remains under pressure from the highs of its 6-month trading range. Additionally, IWM desperately needs to clear and hold over $229.84 before it can attempt new all-time highs.
With that said, keep these support levels in mind, for, if the market begins to break down through next week's trading session, these are the price areas the major indices need to bounce back from.
Follow Mish on Twitter @marketminute for stock picks and more. Follow Mish on Instagram (mishschneider) for daily morning videos. To see updated media clips, click here.
So far this earning season has proven to have some big winners and some big losers! On this week's edition of StockCharts TV's Mish's Market Minute, Mish takes you through those that have already reported and those who are about to report to give you the setups both long and short.
ETF Summary
- S&P 500 (SPY): New highs.
- Russell 2000 (IWM): Held 227.09 the 10-DMA.
- Dow (DIA): Holding near highs and the 10-DMA.
- Nasdaq (QQQ): New highs.
- KRE (Regional Banks): Sitting under the 10-DMA at 71.60.
- SMH (Semiconductors): 262.60 main support area.
- IYT (Transportation): 276.69 high to clear.
- IBB (Biotechnology): 160.29 to clear from the 200-DMA.
- XRT (Retail): Watching for bullish phase change with second close over 93.56 the 50-DMA.
Forrest Crist-Ruiz
MarketGauge.com
Assistant Director of Trading Research and Education


