At the beginning of the week, investors worried as the market sold off. Then, on Thursday, the major indices made a large gap lower, igniting many to believe we had entered the beginning of a bear market. Though investors are still worried about geopolitical pressure, along with worries about rising prices and inflation, the market surprisingly rallied back into its recent range.
With that said, if we look back at Thursday's price action, there was one hint the indices gave us that the market was not ready to continue lower from its price gap.
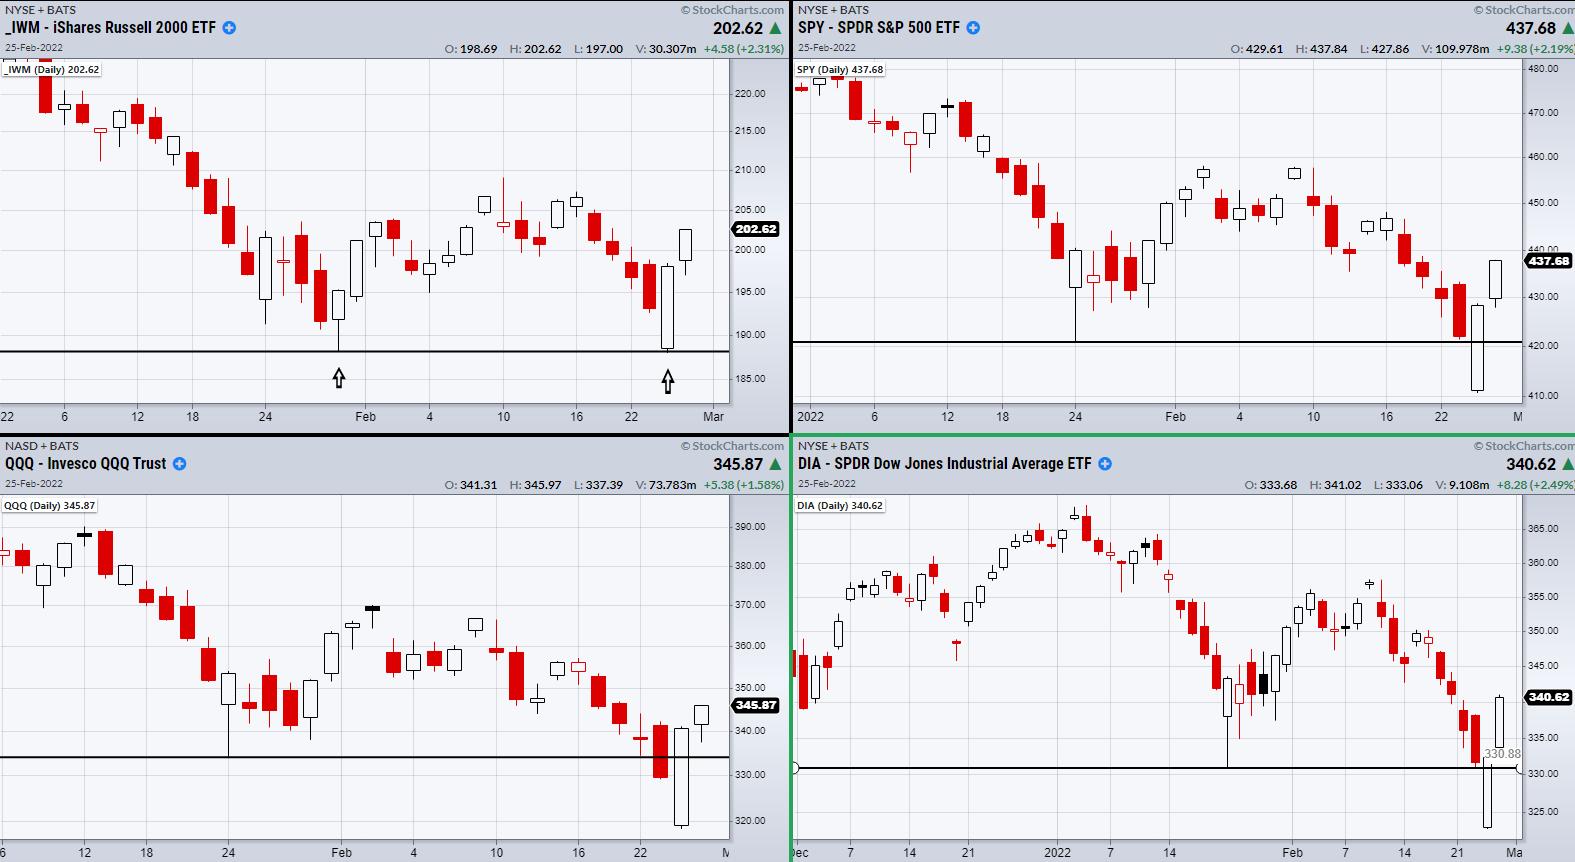
When watching the major indices, it pays to watch all four at the same time. Watching them together shows if they are in agreement when a major move takes place. When the media was entertaining the idea of a bear market, the S&P 500 (SPY), Dow Jones (DIA) and the Nasdaq 100 (QQQ) had all gapped under key lows, as seen in the above charts. However, the Russell 2000 (IWM), which has been one of the weakest indices this year, opened right at support from Jan 28th at $188. This was a hint as IWM was the only index to open at key support. From there, IWM briefly dipped to $187.92 and then made a monster rally.
With that said, this is one of many lessons the market will continue to teach people over time. Never be too quick to decide if a market is bullish or bearish.
Some traders don't like to use these two popular terms when describing the market, as they can cause a biased view of the markets' direction. If you find this to be the case in your thought process, you can instead look at the market direction in the form of trends. The market could be trending upwards, downwards, or sideways. Since the market can quickly change directions, this may help you flip your idea of where the market is going, making it easier to reverse or exit positions when needed.
Follow Mish on Twitter @marketminute for stock picks and more. Follow Mish on Instagram (mishschneider) for daily morning videos. To see updated media clips, click here.
On this week's edition of StockCharts TV's Mish's Market Minute, Mish takes you through four different signs of a bottom and shows you why it's very possible, despite ALL of the bad news, the market may be bottoming. She'll take a deep dive into the macro, showing you that, instead of listening to all the noise, the best place to go for your information is the charts.
Mish also hosted the Friday, February 25th edition of StockCharts TV's Your Daily Five, where she explains why it is a good time to bring out a list of stocks and ETFs to buy, considering that, if the market has bottomed, there is plenty of opportunity.
ETF Summary
- S&P 500 (SPY): Cleared the 10-DMA at 436.10.
- Russell 2000 (IWM): 207 next resistance area.
- Dow (DIA): 340 pivotal.
- Nasdaq (QQQ): Watch to hold over the 344 pivotal.
- KRE (Regional Banks): 76 resistance.
- SMH (Semiconductors): 272 to clear.
- IYT (Transportation): 200-DMA 262.12 to clear.
- IBB (Biotechnology): Sitting right under 10-DMA at 126.52.
- XRT (Retail): 75.67 to hold.
Forrest Crist-Ruiz
MarketGauge.com
Assistant Director of Trading Research and Education


