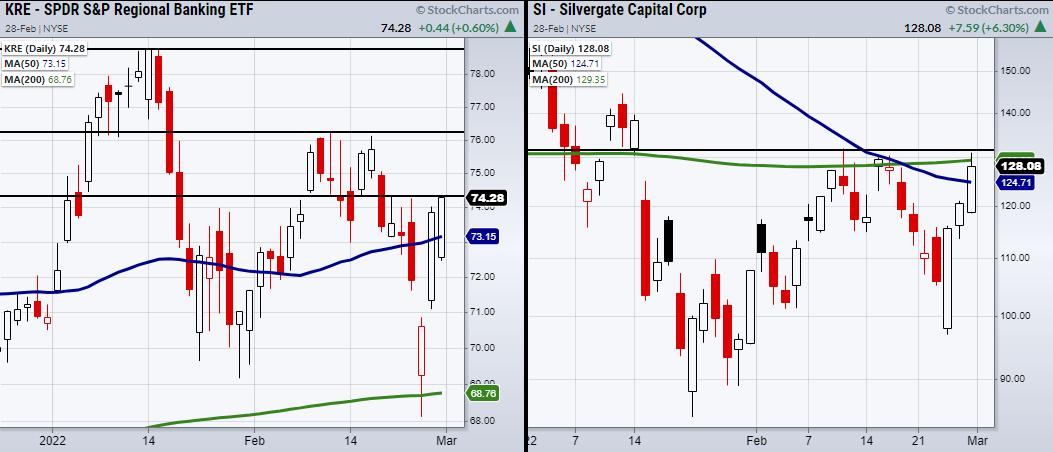
The Regional Banking ETF (KRE) has made two consecutive closes over its 50-day moving average, confirming a bullish phase change. KRE is also the only ETF in Mish's Economic Modern Family that is holding a bullish phase on a daily chart. Therefore, we should keep an eye on KRE, along with its holdings, for trade ideas, given its outperformance compared to the other key ETFs.
Although KRE has confirmed a phase change, we should be careful when timing trades, since the major indices are re-entering a choppy price area. With the current volatility, it would not be surprising to see KRE break back under its 50-DMA at $73.17 if the market begins to stall at its current price levels.
That is why trade entries are so important. Simply buying an outperforming stock/ETF doesn't mean you will make money from a trade. Waiting for the right entry point makes all the difference.
Currently, KRE is sitting at a pivotal price level as seen by the black line in the above chart. $74 is where KRE needs to hold, while $76, and $78.80 are upcoming resistance levels.
With that said, we can look for entry points into KRE over these levels; however, we can also search through KRE's top holdings to look for potential big performers. One of which is Silvergate Capital Corp (SI).
A potential bonus to SI is its ability to provide banking for cryptocurrencies along with regular banking services. Because Bitcoin on Monday cleared back over 41k, this could help give SI an extra boost in price going forward. Currently, SI is lingering under its 200-DMA at $129.35. Ideally, SI will need to clear $131 and hold this price level to completely break out towards the upside.
Follow Mish on Twitter @marketminute for stock picks and more. Follow Mish on Instagram (mishschneider) for daily morning videos. To see updated media clips, click here.
On the latest edition of StockCharts TV's Mish's Market Minute, Mish takes you through four different signs of a bottom and shows you why it's very possible, despite ALL of the bad news, the market may be bottoming. She'll take a deep dive into the macro, showing you that, instead of listening to all the noise, the best place to go for your information is the charts.
ETF Summary
- S&P 500 (SPY): Holding over the 10-DMA at 435.72.
- Russell 2000 (IWM): 208 resistance.
- Dow (DIA): 341 the 10-DMA.
- Nasdaq (QQQ): 344 pivotal.
- KRE (Regional Banks): Needs to hold over 74.
- SMH (Semiconductors): 272 to clear.
- IYT (Transportation): 200-DMA 262.02 to clear.
- IBB (Biotechnology): Flirting with the 10-DMA at 126.12.
- XRT (Retail): 75.67 to hold.
Forrest Crist-Ruiz
MarketGauge.com
Assistant Director of Trading Research and Education


