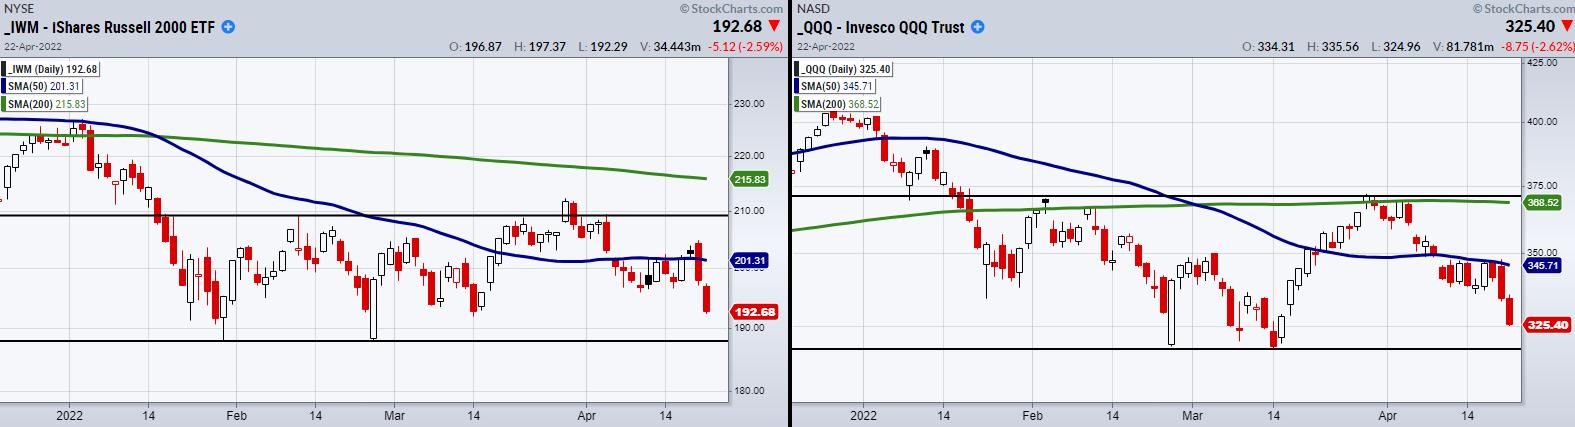
After both the Russell 2000 (IWM) and the Nasdaq 100 (QQQ) failed to hold or clear over the 50-day moving average (blue line), the bleeding has not stopped. Now that IWM and many key ETFs are near the bottom of their trading range, how should we prepare for next week?
Because we are in a stagflation type of environment with weak market growth and rising inflation, we need to be extra careful with how we trade. This led us to believe that trading ranges would give us important areas to watch for entries to the long and short side. As seen in the above chart IWM, and QQQ have been rangebound for some time. (Range highs and lows are shown with black lines.)
However, we can extend watching ranges to other key symbols, such as the transportation (IYT), retail (XRT) and biotech (IBB) ETFs.
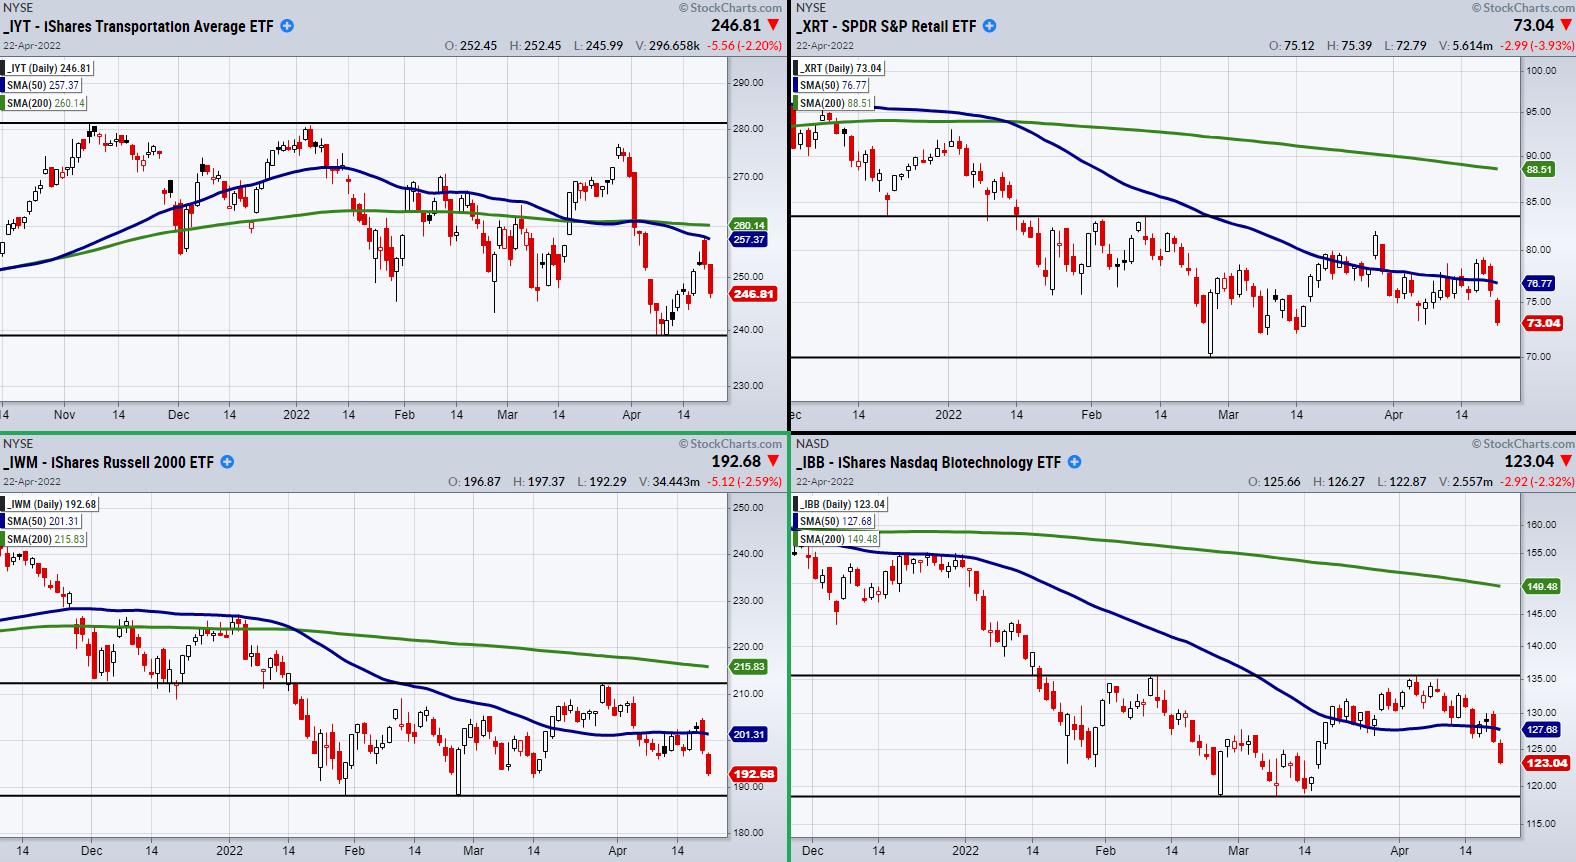
When looking at Monday's trading session, this can help show if we should watch for a bounce near support from the range low or watch for the market to continue breaking down. If only a couple of symbols break the range low, the weak price action could show that the market is looking to bounce. On the other hand, if the ETFs break lower in unison, we could expect another leg down in the market.
Currently, many traders are watching the market from a bearish standpoint. While this can be helpful at times, it can also be frustrating if the market decides to trend sideways or stay rangebound. Therefore, keep an eye on ranges in these symbols, along with anything you are currently watching for trade setups in.
Follow Mish on Twitter @marketminute for stock picks and more. Follow Mish on Instagram (mishschneider) for daily morning videos. To see updated media clips, click here.
As the Federal Reserve buzzes about what to do regarding the energy crisis, the question of how we can get to some sort of clean energy alternative is very much in the spotlight. On this special Earth Day edition of StockCharts TV's Mish's Market Minute, Mish goes through socially conscious and environmentally focused charts. Afterwards, Mish is interviewed by StockCharts TV producer Sky Boggs about the history of Socially Responsible Investing (SRIs) and Environmental Social Governance (ESGs), giving sound advice on what to watch for if you are interested in these investments.
Mish also hosted the Friday, April 22nd edition of StockCharts TV's Your Daily Five. This difficult rangebound market has everyone asking one question: "Are we headed for a bigger meltdown?" Though the market is having struggles, Mish shows there are still some interesting trades to have on your radar.
ETF Summary
- S&P 500 (SPY): 415 next support.
- Russell 2000 (IWM): 191 next support.
- Dow (DIA): 336 support area.
- Nasdaq (QQQ): 317 support.
- KRE (Regional Banks): 63.80 next support.
- SMH (Semiconductors): Broke support from 237.
- IYT (Transportation): 243 minor support.
- IBB (Biotechnology): 118 next support.
- XRT (Retail): 73 needs to hold.
Forrest Crist-Ruiz
MarketGauge.com
Assistant Director of Trading Research and Education