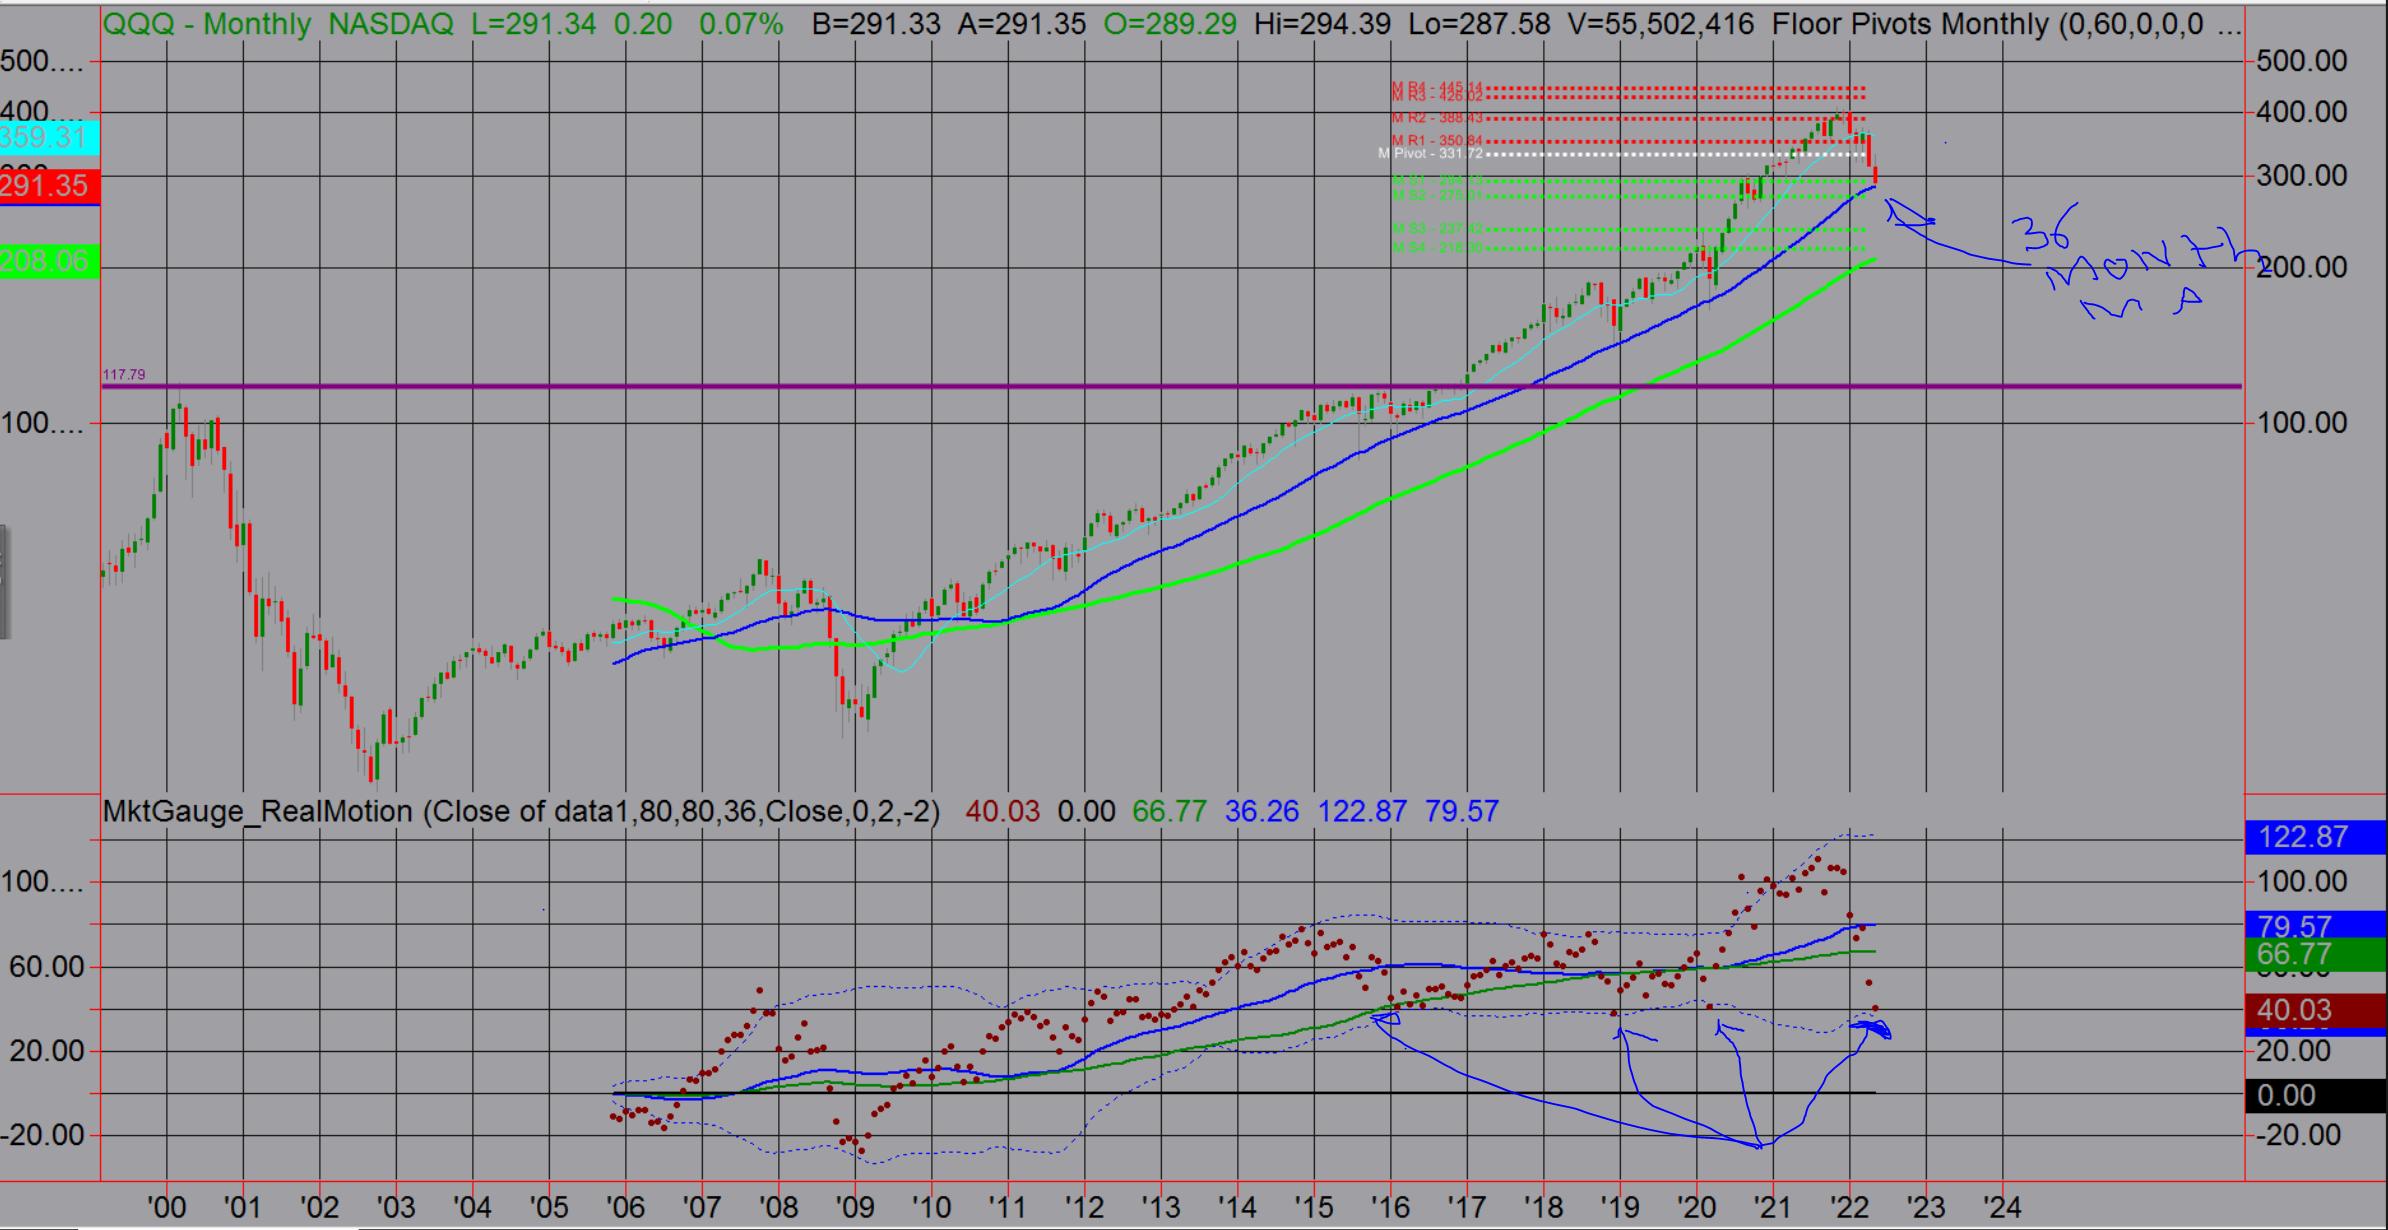
Since 2010, QE saved the markets and the economy, which in turn led to big tech as the 10-year bull market savior. The monthly chart of QQQs, which goes back from the dot com bubble, highlights the run that began in 2010. Yet it also shows that it took another six years (2016) until the peak of the dot-com bubble was taken out.
The first sentence might be the most important. It begins with "QE saved..."
The Nasdaq 100 peaked again in November 2021. Since then, the letters QE are now replaced with QT. In fact, June officially begins the Fed's shrinking of an $8.5 trillion bond portfolio. Some say it's already priced into the bond market. Others say we have not seen anything yet as far as collateral damage from rising yields.
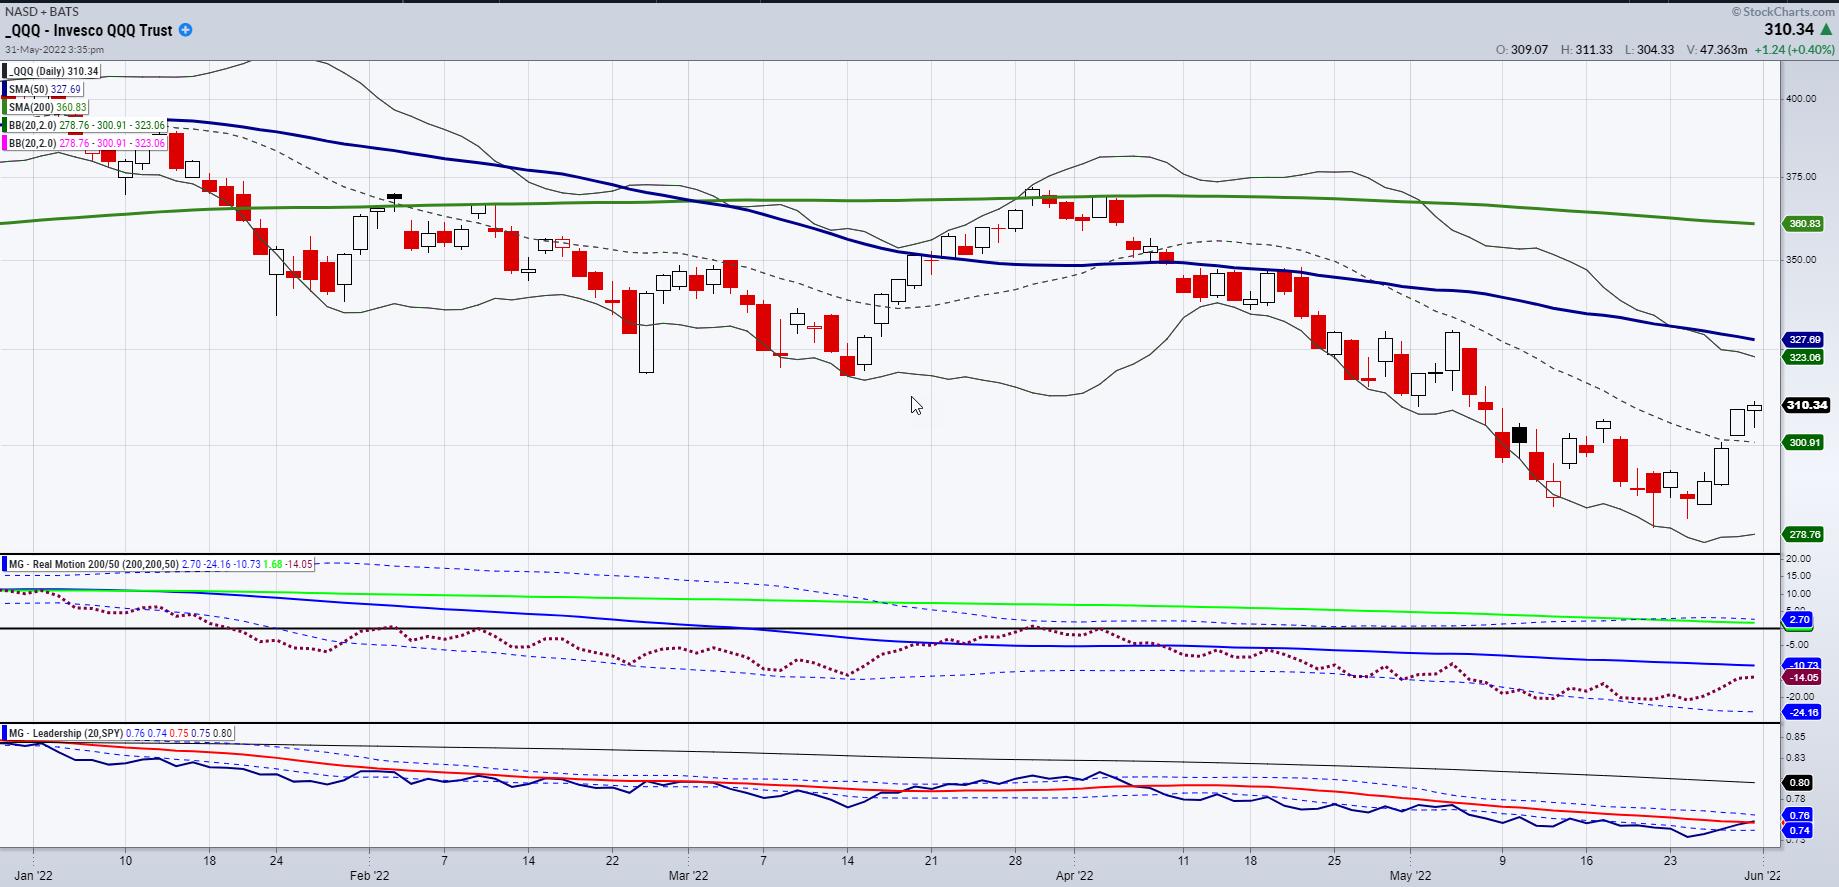
What is the chart telling us? NASDAQ spent most of the day green, only to close down .18% in the last few minutes of the session. The chart does not illustrate the classic reversal bottom, as many hoped for.
We did have a new 60+ day low on May 2oth. However, it was followed by an inside day, which was then followed by a red day. In fact, the high from the candle on May 20th did not clear until last Thursday--and on low volume. Last Friday, the volume was lower still.
Technically, we do not need to see a clean reversal bottom, or one where a new low is made and then the high of that day clears within one to two days max. But we like it when it happens. So now this points more to a bear market rally with new lows most likely on the horizon. Especially if QQQs fail 295 again.
Could more upsides be in store? Maybe. A chance QQQS could run to 318--but why?
Call me a skeptic, but let's go back to the monthly chart. That run was with QE and it still took from 2000 until 2016 for the peak highs to clear--16 years!
Now we have QT--duh--big red truck!
Follow Mish on Twitter @marketminute for stock picks and more. Follow Mish on Instagram (mishschneider) for daily morning videos. To see updated media clips, click here.
See Mish in a brief clip from BizFirst AM!
ETF Summary
- S&P 500 (SPY): 400 major support, 425 resistance.
- Russell 2000 (IWM): 180 support, 192 resistance.
- Dow (DIA): 320 support, 336 resistance.
- Nasdaq (QQQ): 295 support, 327 resistance.
- KRE (Regional Banks): Rally to resistance not interesting unless it clears 66.
- SMH (Semiconductors): 247 resistance with 228 nearest support.
- IYT (Transportation): Weaker sector with 227 some support to hold.
- IBB (Biotechnology): 117 pivotal and under 110 support trouble.
- XRT (Retail): Oversold otherwise, 64 support and maybe new life over 73.00.
Mish Schneider
MarketGauge.com
Director of Trading Research and Education


