Buying ahead of taking out last week's high was premature. Getting overly negative unless we fail last week's low is equally premature.
I realize how sexy it is to be either very bullish or very bearish. And I realize that given many different reasons, the sentiment leans very bearish. However, we keep telling you that, in a stagflation environment, which everyone agrees we have right now, a trading range is established. What that means is if you go back in time, to the mid 1970's, a low can be established, yet the velocity and top of the range of the ensuing rally can be muted. And this can go on for years. Not in every instrument of course, but as we dissect the Economic Modern Family, we see this week as nothing more than an inside week.
Is it too soon to say then if the low is in?
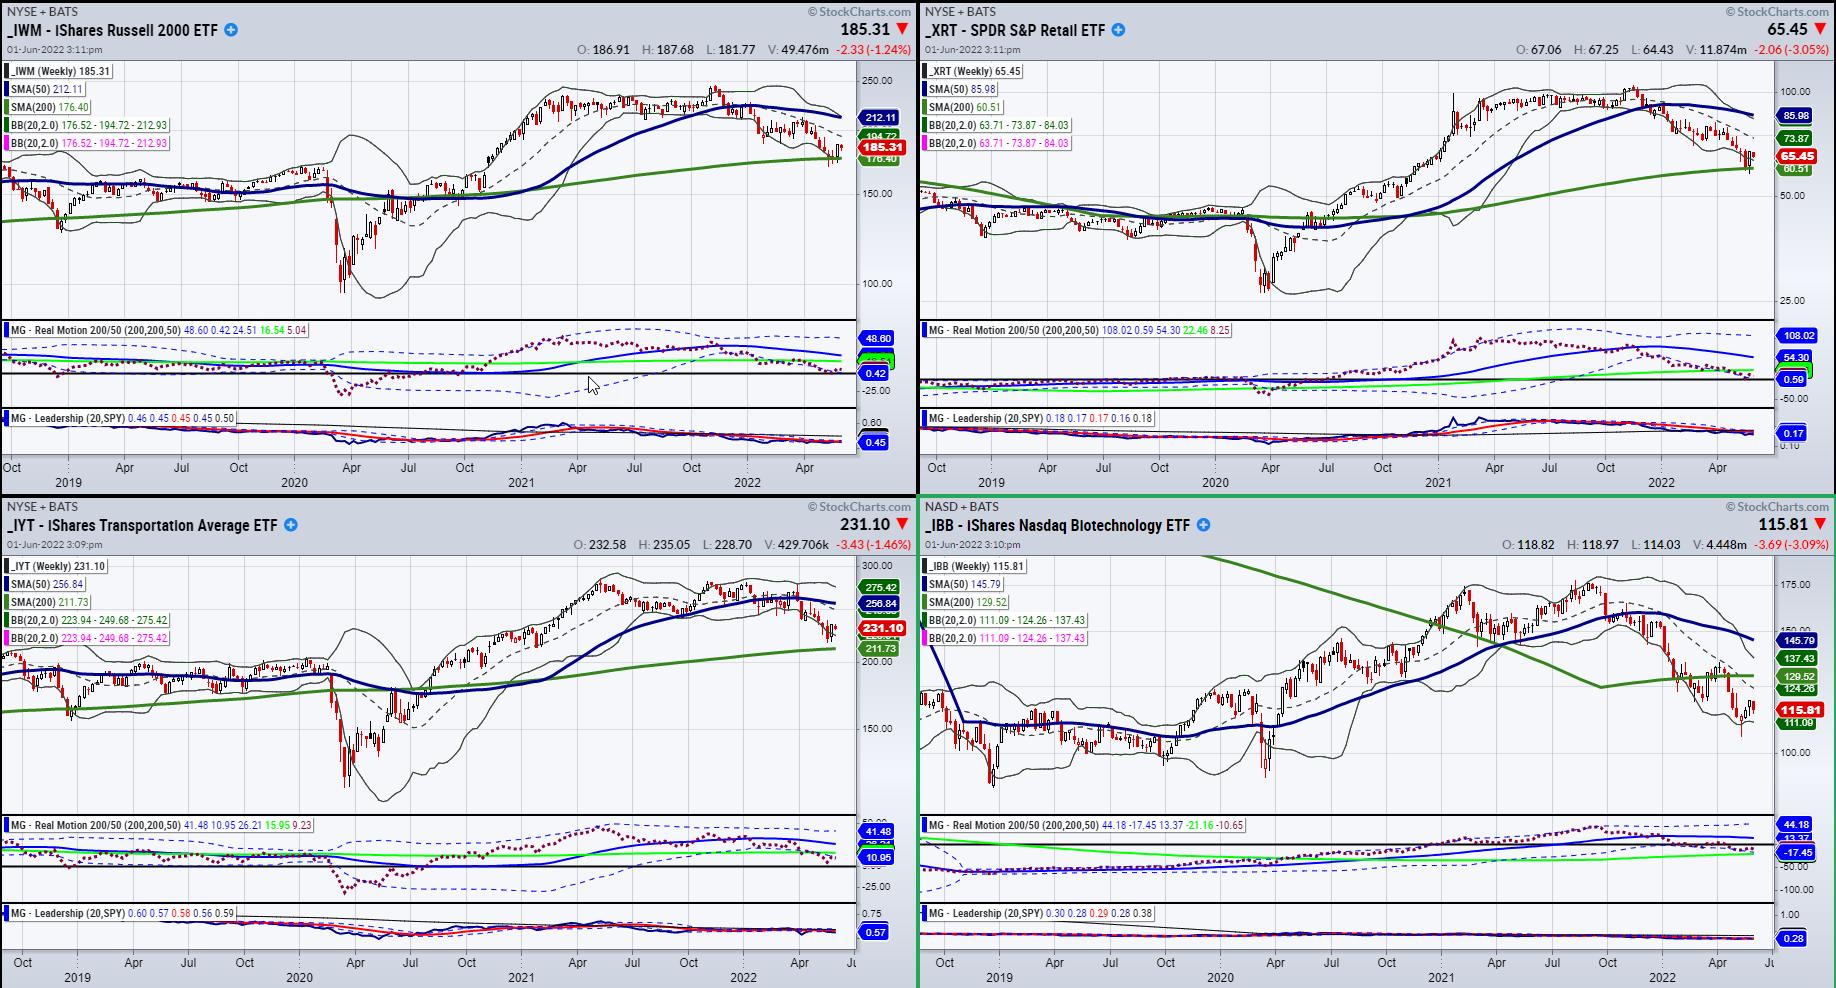
The chart of the Russell 2000, Retail, Transportation and Biotechnology are key charts. They are all weekly charts. All four sectors are having inside weeks, which means they are all trading within last week's trading ranges. Three of the four charts held their 200-week moving averages. The exception is Biotechnology, which broke it in mid-April.
The Russell 2000 IWM is interesting, as not only has it not had a closing week under the 200-WMA, but it also held a gap from November 2020. The low that week it gapped higher than in 11/2020 was 168.34. Recent low in IWM is 168.90.
Now here is the rub. If these lows break clearly, we have a new leg lower. And if they those lows do not break, it seems we have an established trading range to work from. Where is resistance? Too soon to say. Yet let's assume the level of 190-200 is the big resistance given the Fed, inflation, and so on.
Could IWM and the others trade within a $40-50 range for a while? Absolutely. Our job is to find the sectors that are not beholden to stagflation and, like the oil and energy sectors to date, which sectors become the new market leaders until such time the U.S. sees some real growth and our Granddad can take out the 2021 highs.
Follow Mish on Twitter @marketminute for stock picks and more. Follow Mish on Instagram (mishschneider) for daily morning videos. To see updated media clips, click here.
Check out Mish's latest appearance hosting StockCharts TV's Your Daily Five series, where she covers which alternative energy stocks to buy and when!
Also watch Mish's appearance on TD Ameritrade, where she covers trading ranges, which sectors like China can do well and why gold is worth a buy and hold.
And watch a short Mish appearance on BizFirst AM!
ETF Summary
- S&P 500 (SPY): 400 major support, 425 resistance.
- Russell 2000 (IWM): 180 support, 192 resistance.
- Dow (DIA): 320 support, 336 resistance.
- Nasdaq (QQQ): 295 support, 327 resistance.
- KRE (Regional Banks): Rally to resistance; not interesting unless it clears 66.
- SMH (Semiconductors): 247 resistance with 228 nearest support.
- IYT (Transportation): Weaker sector with 227 some support to hold.
- IBB (Biotechnology): 117 pivotal and under 110 support trouble.
- XRT (Retail): 64 support and maybe new life over 73.00.
Mish Schneider
MarketGauge.com
Director of Trading Research and Education


