It's been a volatile few weeks in the markets, and it can be hard to tell if we're currently in a risk-on or risk-off environment. Have we seen the market lows for 2022, or will the market reverse lower before the end of the year?
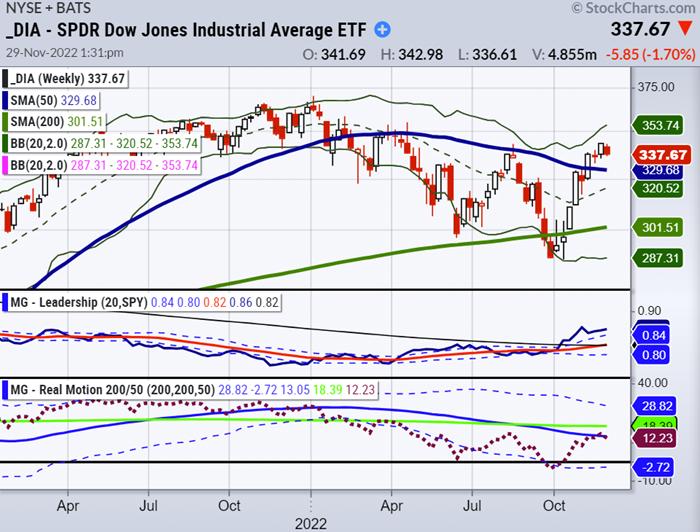 CHART 1: SPDR DOW JONES INDUSTRIAL AVERAGE ETF (DIA) ABOVE ITS 200-DAY MOVING AVERAGE. If DIA holds 329 in the weekly chart, we could see a sustained uptrend. Chart source: StockCharts.com
The market indicates that investors favor large-cap defensive sectors. The Dow Jones Industrial Average (using the SPDR Dow Jones Industrial Average DIA as a proxy) leads the indices, with Utilities, Consumer Staples, and Health Care sectors ahead of the pack. Looking at the major indices, DIA is the only major U.S. index above its 200-week moving average. DIA needs to hold 329 at the weekly close to remain in an uptrend (see chart 1).
Many pundits are debating whether we will have a Fed-engineered soft landing or a deep recession in 2023. Will OPEC cut production or raise levels? Will we exhaust the strategic petroleum reserves, or will the move to deplete the SPR combat inflation effectively and keep oil prices down in 2023? These are fair questions to anticipate clarifying current risk-on or risk-off sentiment.
So, where does the market go from here?
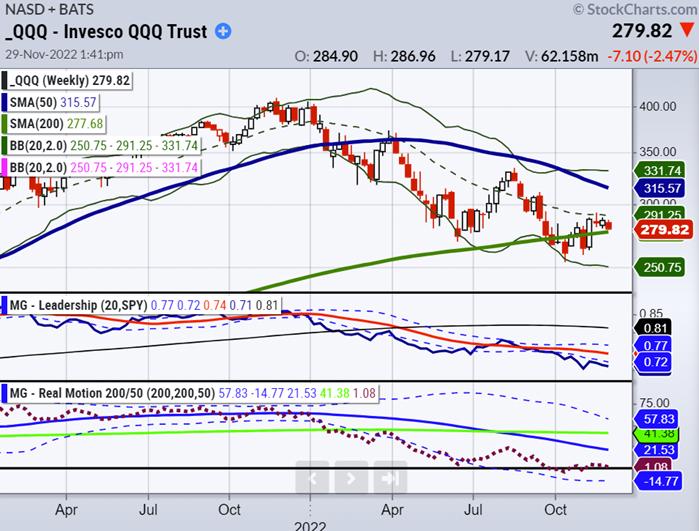 CHART 2; QQQ TRYING TO RECOVER. QQQ needs to hold its weekly trend and stay above 280 in the weekly chart. Chart source: StockCharts.com
This market has been anything but stable of late—one minute up, then down within days. The Nasdaq Composite Index (using QQQ as a proxy) is in a recovery phase, along with the S&P 500 Index (using SPY as a proxy) and small caps (IWM). The QQQs need to hold their weekly trend and stay above 281 at the weekly close to neutralize further downside.
Other indicators are less reliable than price, momentum, and phase. For example, the yield curve is inverted on the short-term part of the curve, yet remains relatively flat on the longer end, providing little clarity into where long-term rates are ultimately headed. The yield curve also continues to invert on the short end while remaining flat on the longer end, which could be an early indicator of a recession. Yet, third-quarter GDP estimates are looking encouraging.
The risk-on/risk-off phenomenon has existed for as long as financial markets have existed. There are clearly many mixed signals today. Understanding how the risk-on/risk-off construct works can be helpful for making more informed trading decisions and protecting your portfolio against dramatic swings. While it can be hard to predict an exact risk on or risk off shift, it's essential to be aware of its overall impact on asset pricing.
We have a daily research service called Big View, which helps clarify risk on and risk-off sentiment by utilizing many indicators to produce an overall view. Currently, the risk indicators are 100% risk-off. Monitoring our proprietary trading indicators and key price trends of major US indices will give you a better idea of when to take on more risk or protect your trading with tighter stops.
If you want to succeed in the financial markets, you must have a thorough grasp of what drives investor sentiment, how it varies over a day, week, or quarter, and how to assess these changes over more extended trading periods.
Rob Quinn, our Chief Strategy Consultant, can provide more information about our proprietary trading indicators and Mish's trading service. Click here to learn more about Mish's Premium trading service with a complimentary one-on-one consultation.

"I grew my money tree and so can you!" - Mish Schneider
Get your copy of Plant Your Money Tree: A Guide to Growing Your Wealth and a special bonus here.
Follow Mish on Twitter @marketminute for stock picks and more. Follow Mish on Instagram (mishschneider) for daily morning videos. To see updated media clips, click here.
Mish in the Media
Mish talks stagflation in her interview by Dale Pinkert during the F.A.C.E. webinar.
Watch Mish's appearance on Business First AM here.
Mish hosted the Monday, November 28 edition of StockCharts TV's Your Daily Five, where she covered some of the Modern Family. She also discusses the long bonds and gold with levels to clear or, fail.
ETF Summary
- S&P 500 (SPY): The resistance at 400-405 remains persistent with support at 387.
- Russell 2000 (IWM): 190 is the ultimate point to clear. Support to hold 180.
- Dow (DIA): Inside week, which means we want to see this hold 335.50 to stay in the game.
- Nasdaq (QQQ): Weakest index. Has to clear 290 or hold 275, or else trouble.
- KRE (Regional Banks): 65.00 resistance and 60 support.
- SMH (Semiconductors): 209 is the biggest support level to hold.
- IYT (Transportation): 217 support and 232 big resistance.
- IBB (Biotechnology): 129 support and 135 resistance.
- XRT (Retail): Over 67.00, we could see a Santa Claus Rally. Under 62.00, big failure.
Mish Schneider
MarketGauge.com
Director of Trading Research and Education
Wade Dawson
MarketGauge.com
Portfolio Manager


