Some of you might have already heard us speak about the monthly moving averages or have read our commentary about their significance.
On Monday, we asked, "What if the trading range top at 4200 we have been calling for in the S&P 500 turns out to be... the top?" Then, on Fox Business' Making Money with Charles Payne, I discussed the 2-year business cycle.
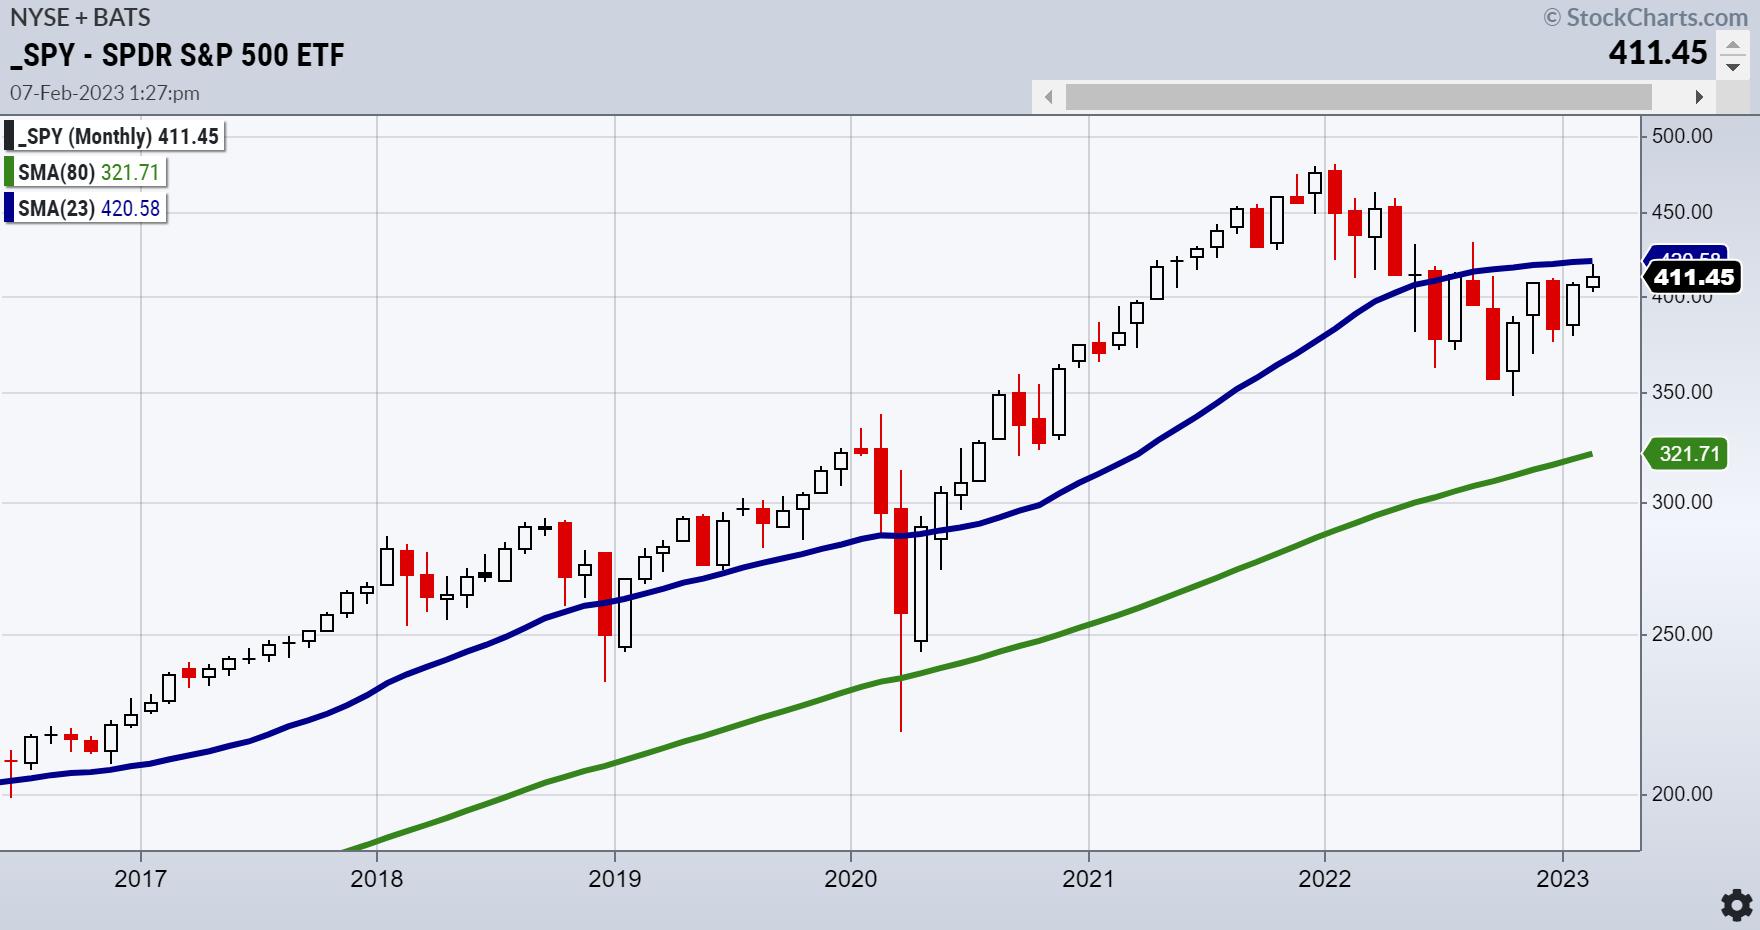
Today, we show you the charts on how that business cycle looks. A two year or 23-month moving average in blue is at the very least, interesting.
What has happened in the last two years?
- A bullish run in 2021 based on easy money.
- Inflation running hotter than most expected.
- The banks caught off guard... and by 2022... party over.
So, that really begs the question of why this year's 23-month moving average is one of the most important indicators for equities.

The chart above is of the iShares Russell 2000 ETF (IWM). Even cleaner perhaps. As Granddad of the Economic Modern Family, a break and close over the 23-month MA would be enough evidence to believe in a soft landing and good news for the economy and market. A failure to pierce that MA means chop. A break of the also majorly important 80-month MA (green) that represents a six to seven year business cycle-bad... very bad.
In October, IWM held the 80-month MA which led us to believe that a recession would be averted. Now, the market literally hangs in the balance between a longer-term and a shorter-term business cycle.
Trust the charts and know your timeframe.
For more detailed trading information about our blended models, tools and trader education courses, contact Rob Quinn, our Chief Strategy Consultant, to learn more.
IT'S NOT TOO LATE! Click here if you'd like a complimentary copy of Mish's 2023 Market Outlook E-Book in your inbox.


"I grew my money tree and so can you!" - Mish Schneider
Get your copy of Plant Your Money Tree: A Guide to Growing Your Wealth and a special bonus here.
Follow Mish on Twitter @marketminute for stock picks and more. Follow Mish on Instagram (mishschneider) for daily morning videos. To see updated media clips, click here.
Mish in the Media
Read about Mish's interview with Neils Christensen in this article from Kitco!
In this appearance on Making Money with Charles Payne, Charles and Mish discuss whether Powell can say mission accomplished.
Mish shares her views on how to approach the earnings announcements of Apple, Amazon, and Alphabet, and gives her technical outlook on how the earnings results could impact the S&P 500 and Nasdaq 100 in this appearance on CMC Markets.
Listen to Mish on Chuck Jaffe's Money Life, beginning around the 27-minute mark.
Kristin and Mish discuss whether or not the market has run out of good news in this appearance on Cheddar TV.
Harry Melandri and Mish discuss inflation, the Federal Reserve, and all the sparkplugs that could ignite on Real Vision.
Jon and Mish discuss how the market (still rangebound) is counting on a dovish Fed in this appearance on BNN Bloomberg.
Mish discusses price and what indices must do now in this appearance on Making Money with Charles Payne.
In this appearance on TheStreet.com, Mish and JD Durkin discuss the latest market earnings, data, inflation, the Fed and where to put your money.
In this appearance on CMC Markets, Mish digs into her favourite commodity trades for the week and gives her technical take on where the trading opportunities for Gold, oil, copper, silver and sugar are.
ETF Summary
- S&P 500 (SPY): 420 resistance with 390-400 support.
- Russell 2000 (IWM): 190 now support and 202 major resistance.
- Dow (DIA): 343.50 resistance and the 6-month calendar range high.
- Nasdaq (QQQ): 300 is now the pivotal area.
- Regional banks (KRE): 65.00 resistance.
- Semiconductors (SMH): 248 is the 23-month moving average--key.
- Transportation (IYT): The 23-month MA is 244--now resistance.
- Biotechnology (IBB): Sideways action.
- Retail (XRT): 78.00 the 23-month MA, resistance and nearest support 68.00.
Mish Schneider
MarketGauge.com
Director of Trading Research and Education