What if the trading range top at 4200 we have been calling for in the S&P 500 turns out to be... the top?
Certainly, we can make a case for it given higher yields, strong dollar, geopolitical stress, debt issues, government spending, and no real proof we have beaten the battle of inflation.
We at MarketGauge love math. We love indicators. We love risk/reward.
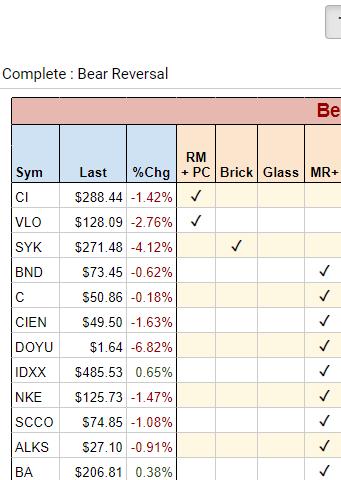
The table called Complete: Bear Reversal shows you a list of trades using some of our proprietary software. This list of stocks was updated after the close. It ranges from stocks well-underperforming to stocks that are near, but couldn't clear 52-week highs.
We will show you 3 indicators, and we'll walk you through 1 trade on the list.
Real Motion and Phase Change — Mish's book covers that in detail. For our purposes, we will focus on Real Motion. This scanner looks for stocks that show momentum is declining even if price has yet to catch up.
Brick refers to a 2-day pattern. A stock makes a new 60+ day high, then reverses, closing near the lows.
Mean Reversion Plus finds short-term divergences between momentum (Real Motion) and price based on mean-reverting tendencies of stocks.
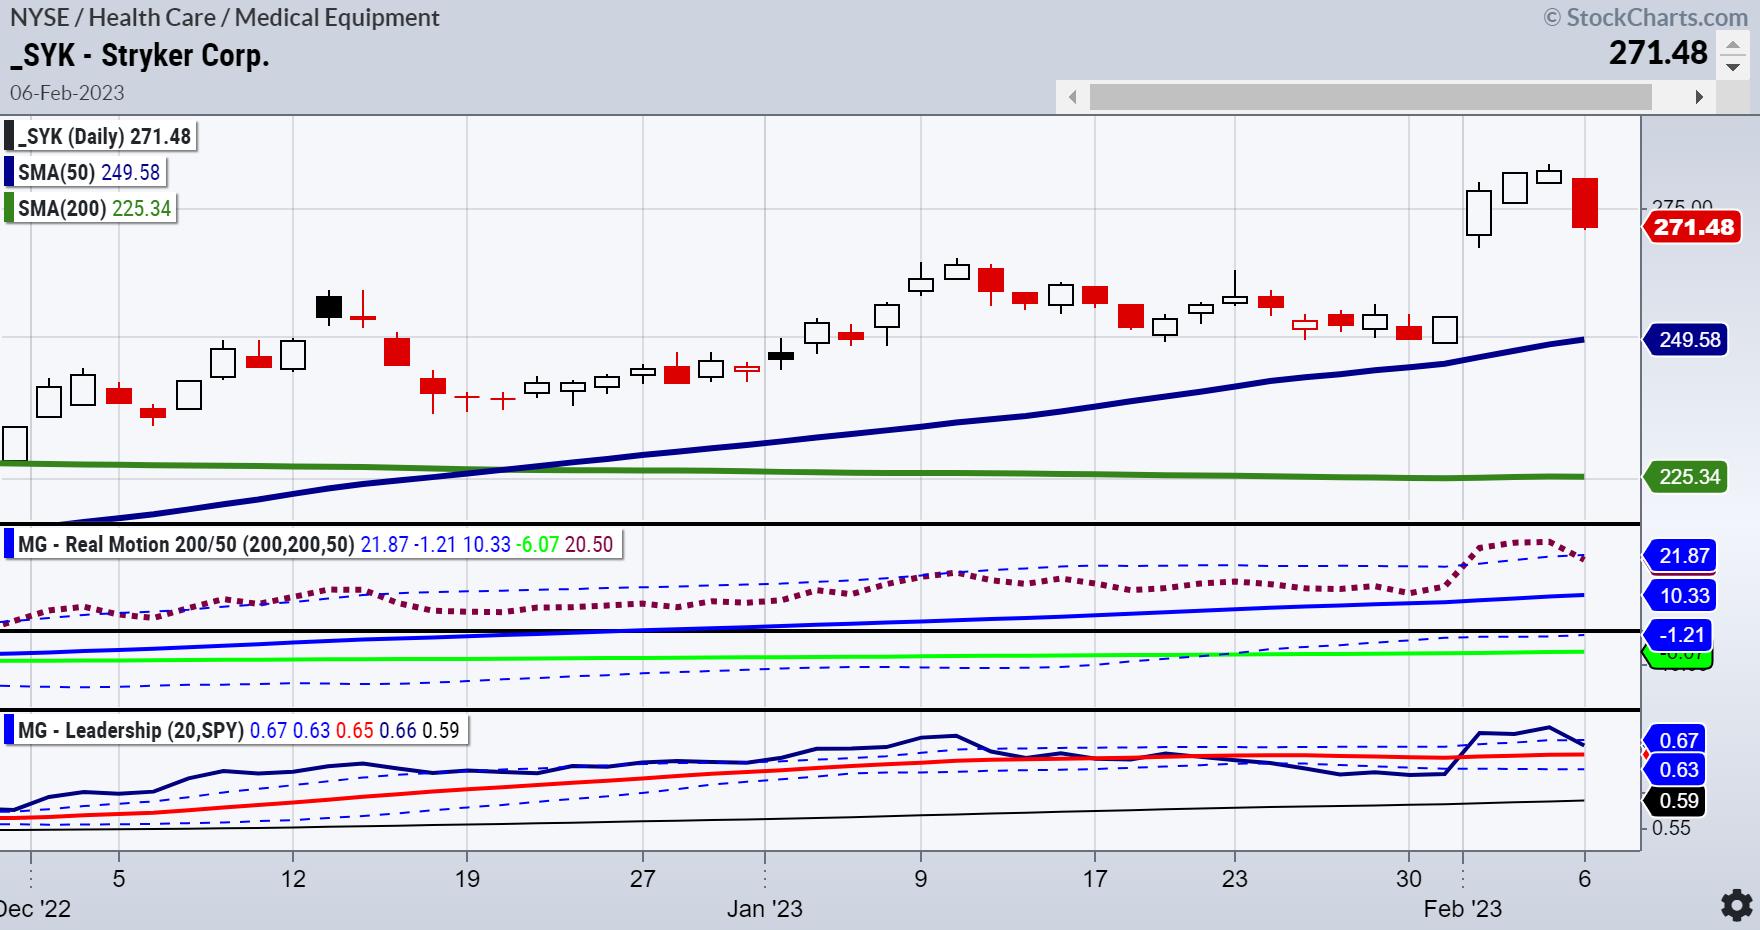
Stryker Corp is in a bullish phase on both the daily and weekly charts. Since Friday, the stock has had a brick pattern confirmed by Monday's action. After a new 60+ day high, the week began by giving the bulls an opportunity to take some profit. It also allowed daytraders to sell under the lows of Friday and make money.
Note that the Real Motion indicator shows the beginnings of a mean reversion. The red squares just crossed under the dotted line or Bollinger Band. Moreover, if that stock has topped out, traders have a risk to above the 60+ day high to possibly see a move closer to $250.
For more detailed trading information about our blended models, tools and trader education courses, contact Rob Quinn, our Chief Strategy Consultant, to learn more.
Click here if you'd like a complimentary copy of Mish's 2023 Market Outlook E-Book in your inbox.


"I grew my money tree and so can you!" - Mish Schneider
Get your copy of Plant Your Money Tree: A Guide to Growing Your Wealth and a special bonus here.
Follow Mish on Twitter @marketminute for stock picks and more. Follow Mish on Instagram (mishschneider) for daily morning videos. To see updated media clips, click here.
Mish in the Media
In this appearance on Making Money with Charles Payne, Charles and Mish discuss whether Powell can say mission accomplished.
Mish shares her views on how to approach the earnings announcements of Apple, Amazon, and Alphabet, and gives her technical outlook on how the earnings results could impact the S&P 500 and Nasdaq 100 in this appearance on CMC Markets.
Listen to Mish on Chuck Jaffe's Money Life, beginning around the 27-minute mark.
Kristin and Mish discuss whether or not the market has run out of good news in this appearance on Cheddar TV.
Harry Melandri and Mish discuss inflation, the Federal Reserve, and all the sparkplugs that could ignite on Real Vision.
Jon and Mish discuss how the market (still rangebound) is counting on a dovish Fed in this appearance on BNN Bloomberg.
Mish discusses price and what indices must do now in this appearance on Making Money with Charles Payne.
In this appearance on TheStreet.com, Mish and JD Durkin discuss the latest market earnings, data, inflation, the Fed and where to put your money.
In this appearance on CMC Markets, Mish digs into her favourite commodity trades for the week and gives her technical take on where the trading opportunities for Gold, oil, copper, silver and sugar are.
ETF Summary
- S&P 500 (SPY): Target 420 with 390-400 support.
- Russell 2000 (IWM): 190 now support and 202 major resistance.
- Dow (DIA): 343.50 resistance and the 6-month calendar range high.
- Nasdaq (QQQ): 300 is now the pivotal area.
- Regional Banks (KRE): 65.00 resistance.
- Semiconductors (SMH): 246 is the 23-month moving average--it failed it Monday on low volume.
- Transportation (IYT): The 23-month MA is 244-now resistance.
- Biotechnology (IBB): Sideways action.
- Retail (XRT): 78.00 the 23-month MA resistance; nearest support 68.00.
Mish Schneider
MarketGauge.com
Director of Trading Research and Education


