Maybe it's just Valentine's Day, so the food and commodities market sees a push to chocolates, flowers, and fine dining.
And maybe not.
The consumer price index (CPI) came out with an unexpected rise... but goods remained softer. Services, on the other hand, rose. However, the core CPI excludes food and energy prices.
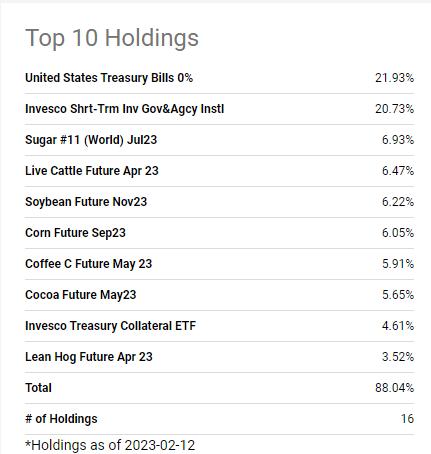
We see no relief in many of the agricultural commodities in the Invesco DB Agricultural Fund ETF. The underlying index includes corn, soybeans, wheat, Kansas City wheat, sugar, cocoa, coffee, cotton, live cattle, feeder cattle, lean hogs, and, most recently, livestock.
The investment seeks to track changes, whether positive or negative, in the level of the DBIQ Diversified Agriculture Index Excess Return™ (the "index") over time, plus the interest income from the fund's holdings of primarily U.S. Treasury securities and money market income less the fund's expenses.
If you want to track how the Fed is doing controlling real inflation, regardless of the inverted yield curve, the rise in long bond yields, or even the U.S. dollar holding support...
Before we review the chart, our quant models have lots of commodities holdings. In particular, the Sector Conservative, Sector Moderate, and GEMS models hold metals and oil exploration. Interestingly, we also hold SOXL or the 3-times leveraged Semiconductor bull (since January 11).
Chips and commodities are where it's at right now. That makes chips as valuable as sugar (one of the largest holdings in DBA). And speaking of sugar, the futures are holding recent highs. Another blast higher in sugar and more chaos could ensue, as we have written about many times. Here is a timely article written in April 2020!!!
The CPI number excludes food. However, while food prices have declined from the peak in July 2022, food inflation sits at 10%. Food at home is 11.3% and food away from home at 8.2%.
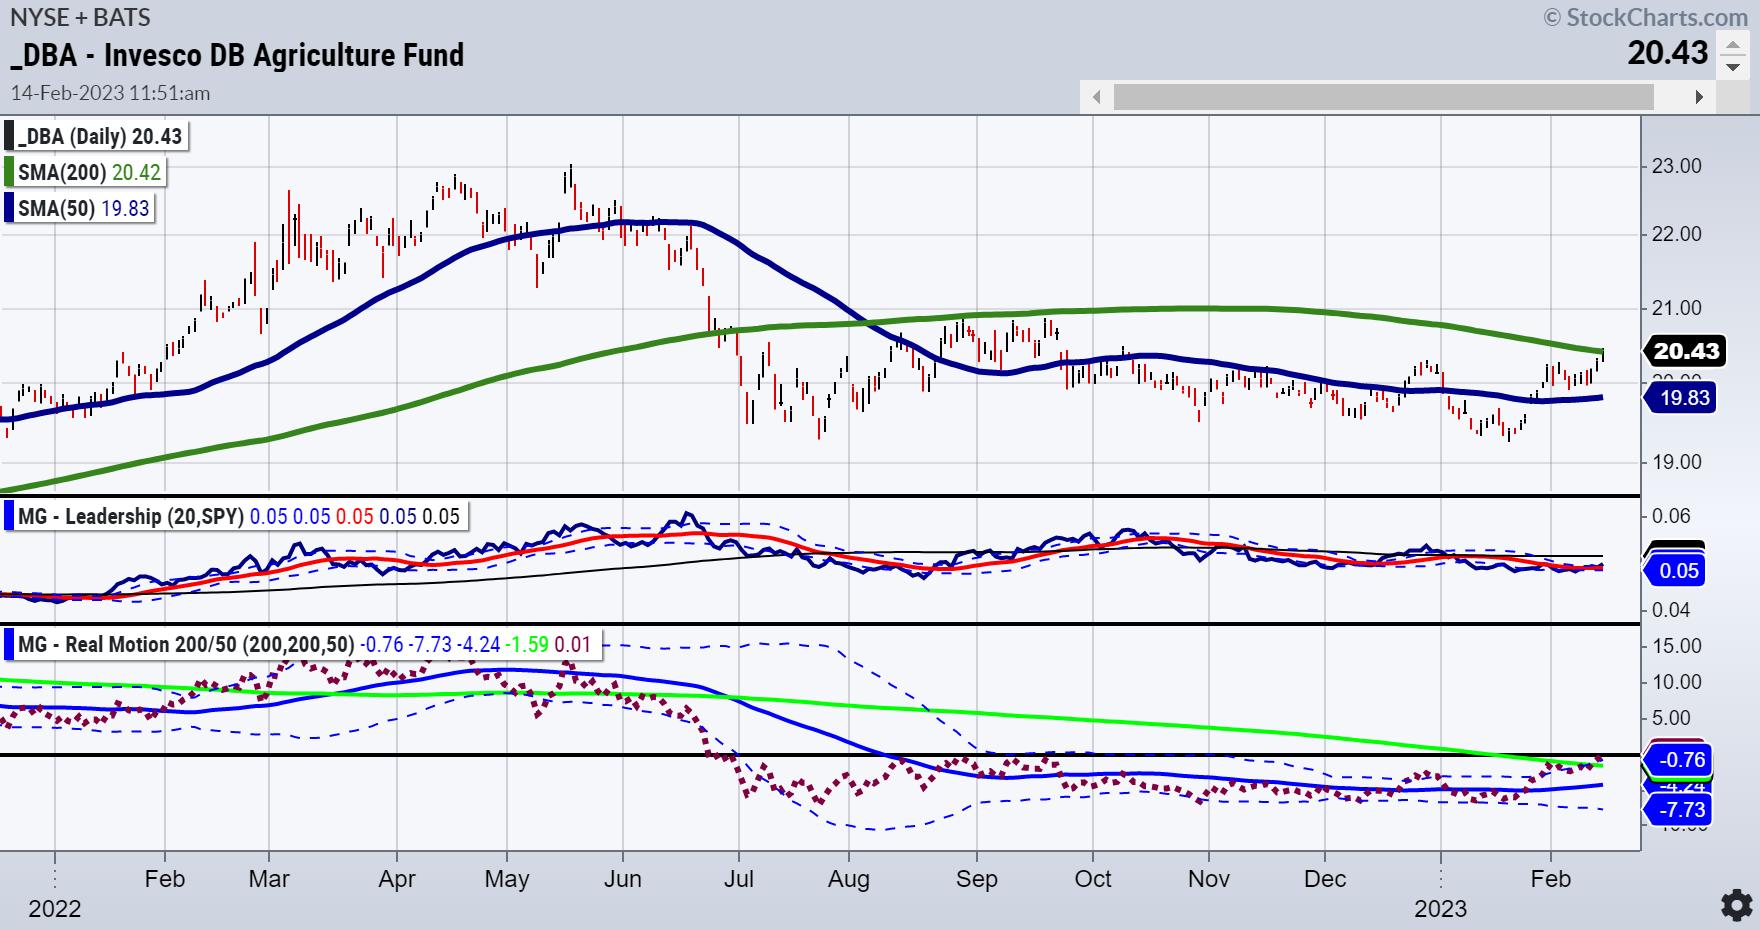
Circling back to the DBA chart, the price rose to clear all of the prior price action since October 2022. However, the 200-day moving average (MA) looms large as resistance with today's high. Also noteworthy is that DBA is now outperforming the benchmark according to our Leadership indicator.
Real Motion had a breakout and diversion to the upside, as the momentum cleared over the 200-day MA and popped to new highs not seen since last September. The diversion is that the momentum indicator cleared the 200-day MA while price has yet to confirm. Something to watch out for.
With the four indexes still rangebound, these continuing bullish trends in the most essential thing on the planet—food—should keep those focusing on A) disinflation and B) a fed pivot a bit quieter.
For more detailed trading information about our blended models, tools and trader education courses, contact Rob Quinn, our Chief Strategy Consultant, to learn more.
IT'S NOT TOO LATE! Click here if you'd like a complimentary copy of Mish's 2023 Market Outlook E-Book in your inbox.


"I grew my money tree and so can you!" - Mish Schneider
Get your copy of Plant Your Money Tree: A Guide to Growing Your Wealth and a special bonus here.
Follow Mish on Twitter @marketminute for stock picks and more. Follow Mish on Instagram (mishschneider) for daily morning videos. To see updated media clips, click here.
Mish in the Media
Mish shares three charts she is using to measure inflation using the commodities markets on the Wednesday, February 14 edition of StockCharts TV's The Final Bar with David Keller!
Mish gives you some ideas of what might outperform in this new wave of inflation on the Friday, February 10 edition of StockCharts TV's Your Daily Five. She has picks from energy, construction, gold, defense, and raw materials.
Read about Mish's interview with Neils Christensen in this article from Kitco!
In this appearance on Making Money with Charles Payne, Charles and Mish discuss whether Powell can say mission accomplished.
Mish shares her views on how to approach the earnings announcements of Apple, Amazon, and Alphabet, and gives her technical outlook on how the earnings results could impact the S&P 500 and Nasdaq 100 in this appearance on CMC Markets.
ETF Summary
- S&P 500 (SPY): 420 resistance with 390-400 support.
- Russell 2000 (IWM): 190 pivotal support and 202 major resistance.
- Dow (DIA): 343.50 resistance, 338 support.
- Nasdaq (QQQ): Nice comeback--still 2 inside weeks working, so watch 311 as a good point to clear or fail from.
- Regional banks (KRE): 65.00 resistance, 61 support.
- Semiconductors (SMH): 248 cleared with the chips rout--254.60 last week's high.
- Transportation (IYT): The 23-month MA is 244--now resistance, 228 support.
- Biotechnology (IBB): Sideways action 130-139 range.
- Retail (XRT): 78.00 the 23-month MA resistance and nearest support 68.00.
Mish Schneider
MarketGauge.com
Director of Trading Research and Education


