
Wednesday morning brought some love to the US economy. The January retail sales rose 3% month/month vs. +2% estimated.
The breakdown fascinates.
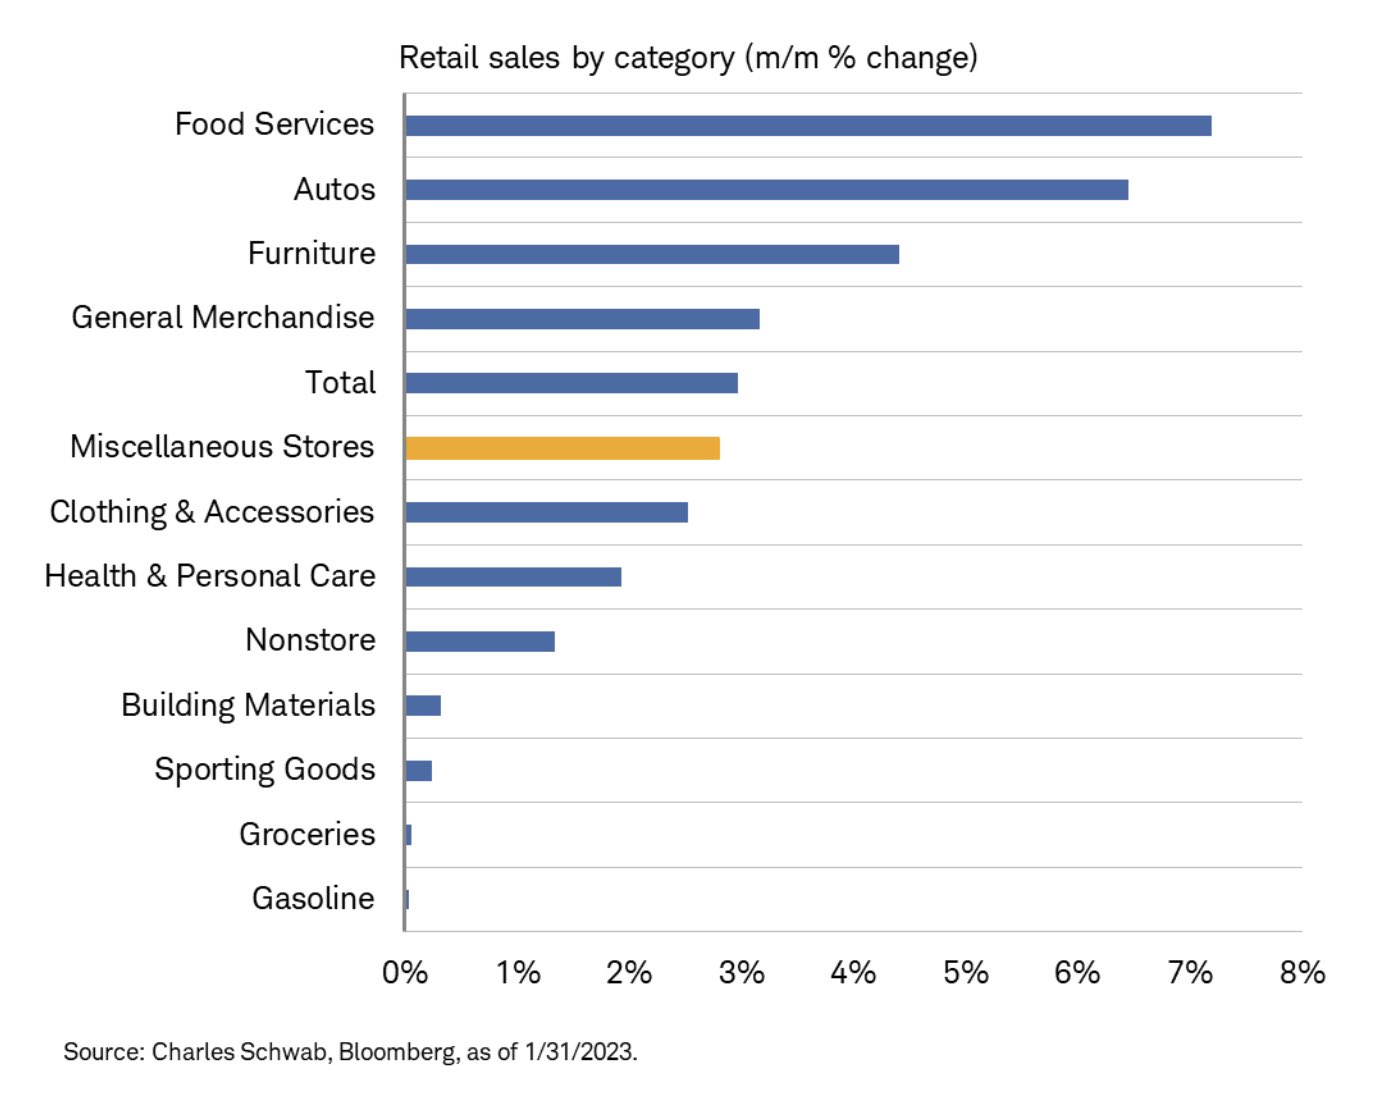
With food inflation where it is, and egg prices the big headline, the leader for today's number is FOOD, particularly eating out. At the bottom of the chart, or with the least rise in sales by retail consumers, is groceries and gasoline.
Makes for some head scratching, really, considering folks bought cars and ate out, but did not gas those cars much or buy a lot of food to cook at home with. Is the whole country buying Teslas and eating at Wingstop?
Both of those stocks did extremely well, with WING making new 52-week highs and Tesla up more than double from its January low.
There's Retail Sales, Then There's Granny Retail
Retail, through the eyes of our Granny of the Economic Modern Family is a great go-to as the basket of XRT has a good blend of e-commerce, brick and mortar, consumer staples, and discretionary goods.
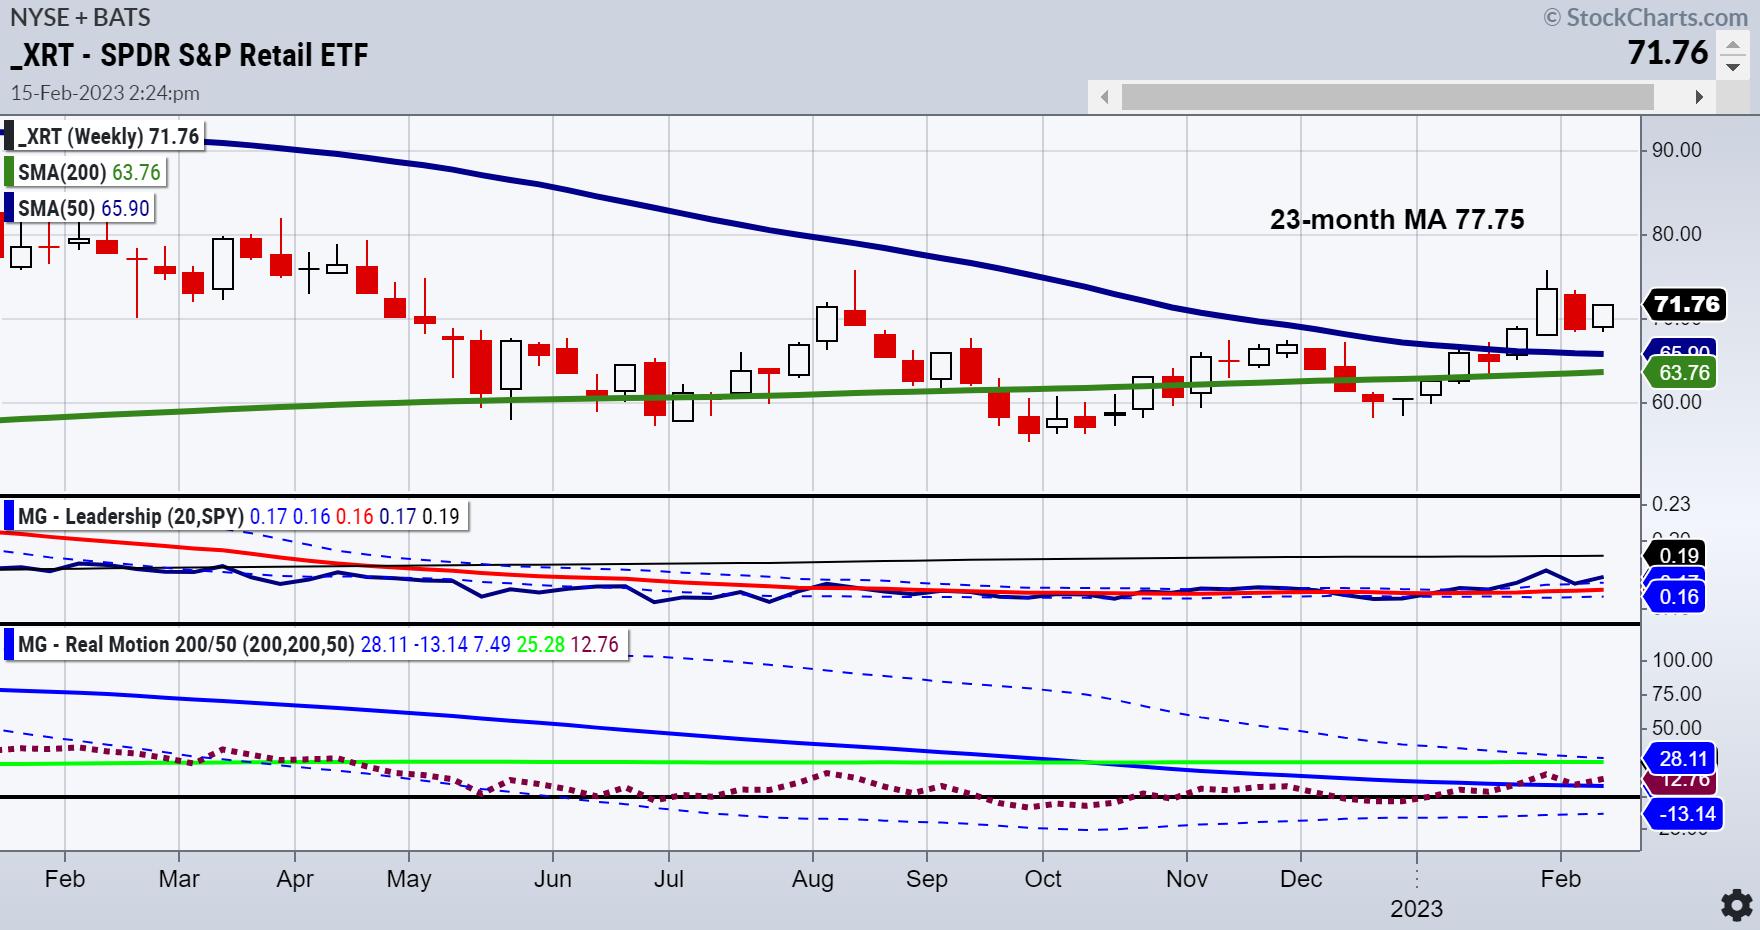
Notice on this weekly chart that the 23-month moving average is much higher than current levels.
Another point is that, with Wednesday's ebbulience, the price remains below last week's high. Furthermore, last week's high remains below the week prior. So, XRT is making lower highs each of the last 3 weeks, but also has found a basis of support at 68.00.
Moving down to our Leadership indicator, Retail is outperforming the benchmark, which makes sense given today's retail sales number. And that is a good thing, given Granny resides next to the Russell 2000 as the king and queen of the U.S. economy. However, neither are proving to us yet that they are entering a growth stage beyond the 2-year business cycle high and can sustain this rally.
Finally, Real Motion, on the bottom, shows a negative divergence. While on the price charts the 50-DMA (blue) is above the 200-DMA (green), the momentum chart looks a bit different. For one, the 200-DMA is above the 50-DMA, so not as strong a phase. Secondly, the momentum red dots are below the 200-DMA while the price is above it on the top chart. And the momentum skips along the 50-DMA.
Although the momentum is weaker, it does not necessarily mean the price cannot go higher. However, it does suggest that the overhead monthly moving average resistance is palpable and bulls can have some fun, but should also remain vigilant.
For more detailed trading information about our blended models, tools and trader education courses, contact Rob Quinn, our Chief Strategy Consultant, to learn more.
IT'S NOT TOO LATE! Click here if you'd like a complimentary copy of Mish's 2023 Market Outlook E-Book in your inbox.


"I grew my money tree and so can you!" - Mish Schneider
Get your copy of Plant Your Money Tree: A Guide to Growing Your Wealth and a special bonus here.
Follow Mish on Twitter @marketminute for stock picks and more. Follow Mish on Instagram (mishschneider) for daily morning videos. To see updated media clips, click here.
Mish in the Media
Mish shares three charts she is using to measure inflation using the commodities markets on the Wednesday, February 14 edition of StockCharts TV's The Final Bar with David Keller!
Mish gives you some ideas of what might outperform in this new wave of inflation on the Friday, February 10 edition of StockCharts TV's Your Daily Five. She has picks from energy, construction, gold, defense, and raw materials.
Read about Mish's interview with Neils Christensen in this article from Kitco!
In this appearance on Making Money with Charles Payne, Charles and Mish discuss whether Powell can say mission accomplished.
Mish shares her views on how to approach the earnings announcements of Apple, Amazon, and Alphabet, and gives her technical outlook on how the earnings results could impact the S&P 500 and Nasdaq 100 in this appearance on CMC Markets.
ETF Summary
- S&P 500 (SPY): 420 resistance with 390-400 support.
- Russell 2000 (IWM): 190 pivotal support and 202 major resistance.
- Dow (DIA): 343.50 resistance, 338 support.
- Nasdaq (QQQ): 300 the pivotal area 290 major support. Nice comeback--still 2 inside weeks working, so watch 311 as a good point to clear or fail from.
- Regional Banks (KRE): 65.00 resistance, 61 support.
- Semiconductors (SMH): 248 cleared, now support - 254.60 last week's high, 248 resistance, 237 then 229 support.
- Transportation (IYT): The 23-month MA is 244--now resistance, 228 support.
- Biotechnology (IBB): Sideways action 130-139 range.
- Retail (XRT): 78.00 the 23-month MA resistance and nearest support 68.00.
Mish Schneider
MarketGauge.com
Director of Trading Research and Education


