After the CORE PCE numbers came out on Friday, the market had the expected reaction of selling off in anticipation of a more aggressive Fed.
We find the reaction less than surprising. But what we do find more surprising is that the metals sank along with equities, although gold fell less than 1% while silver fell over 2.5% and the S&P 500 fell just over 1%. Oil, on the other hand, and the oil sectors (exploration and service) all rose.
Last week I wrote about natural gas (UNG) and how that had a textbook blow-off bottom at $7.40 a share. Natural gas closed the week up over 20% from that price.
The energy sector, like all commodities, cycles within a cycle.
Speaking of cycles, the indices only rallied into the 23-month moving average or 2-year business cycle resistance (point where they are guilty until proven innocent as far as a soft landing) before last week's painful retreat. Natural gas was left for dead, as it too broke well below its 2-year business cycle. And, to date, we do not really know if this rally is like the indices--a bear market rally or the beginning of a more sustained up cycle.
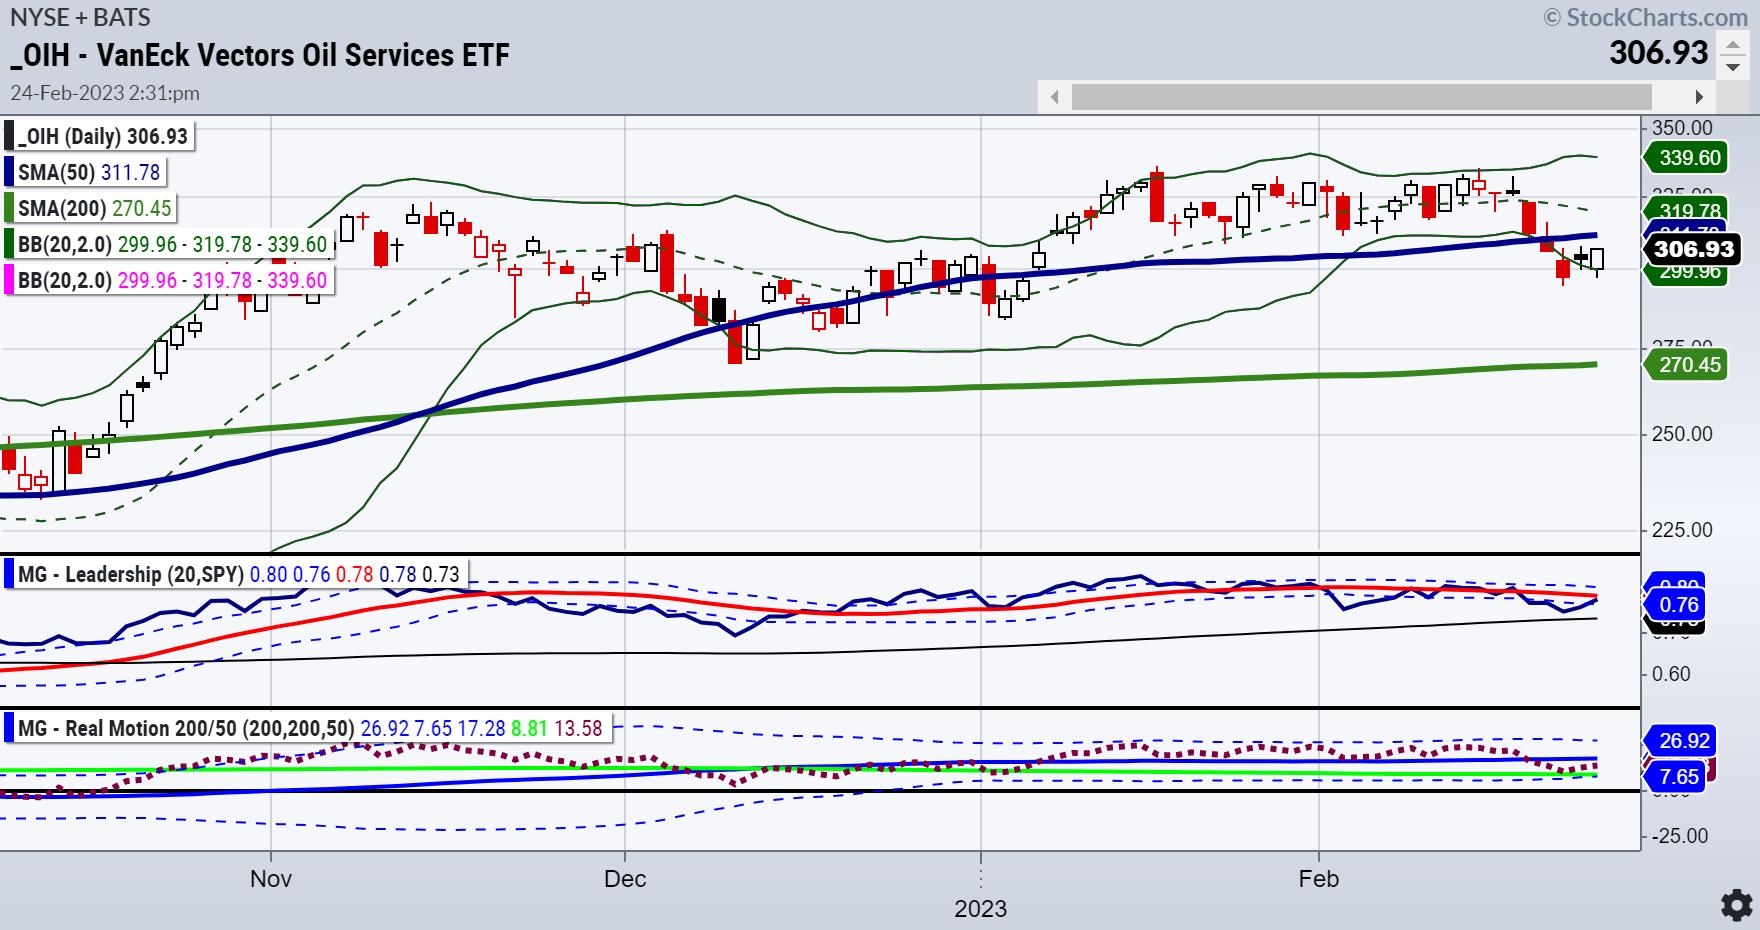
What we do know is that OIH, XLE and the U.S. Oil Fund (USO) all closed green on Friday, and basically unchanged for the week. Furthermore, all are ABOVE their 23-month moving average or 2-year business cycle.
Will energy continue to go up? And what does that mean for the market?
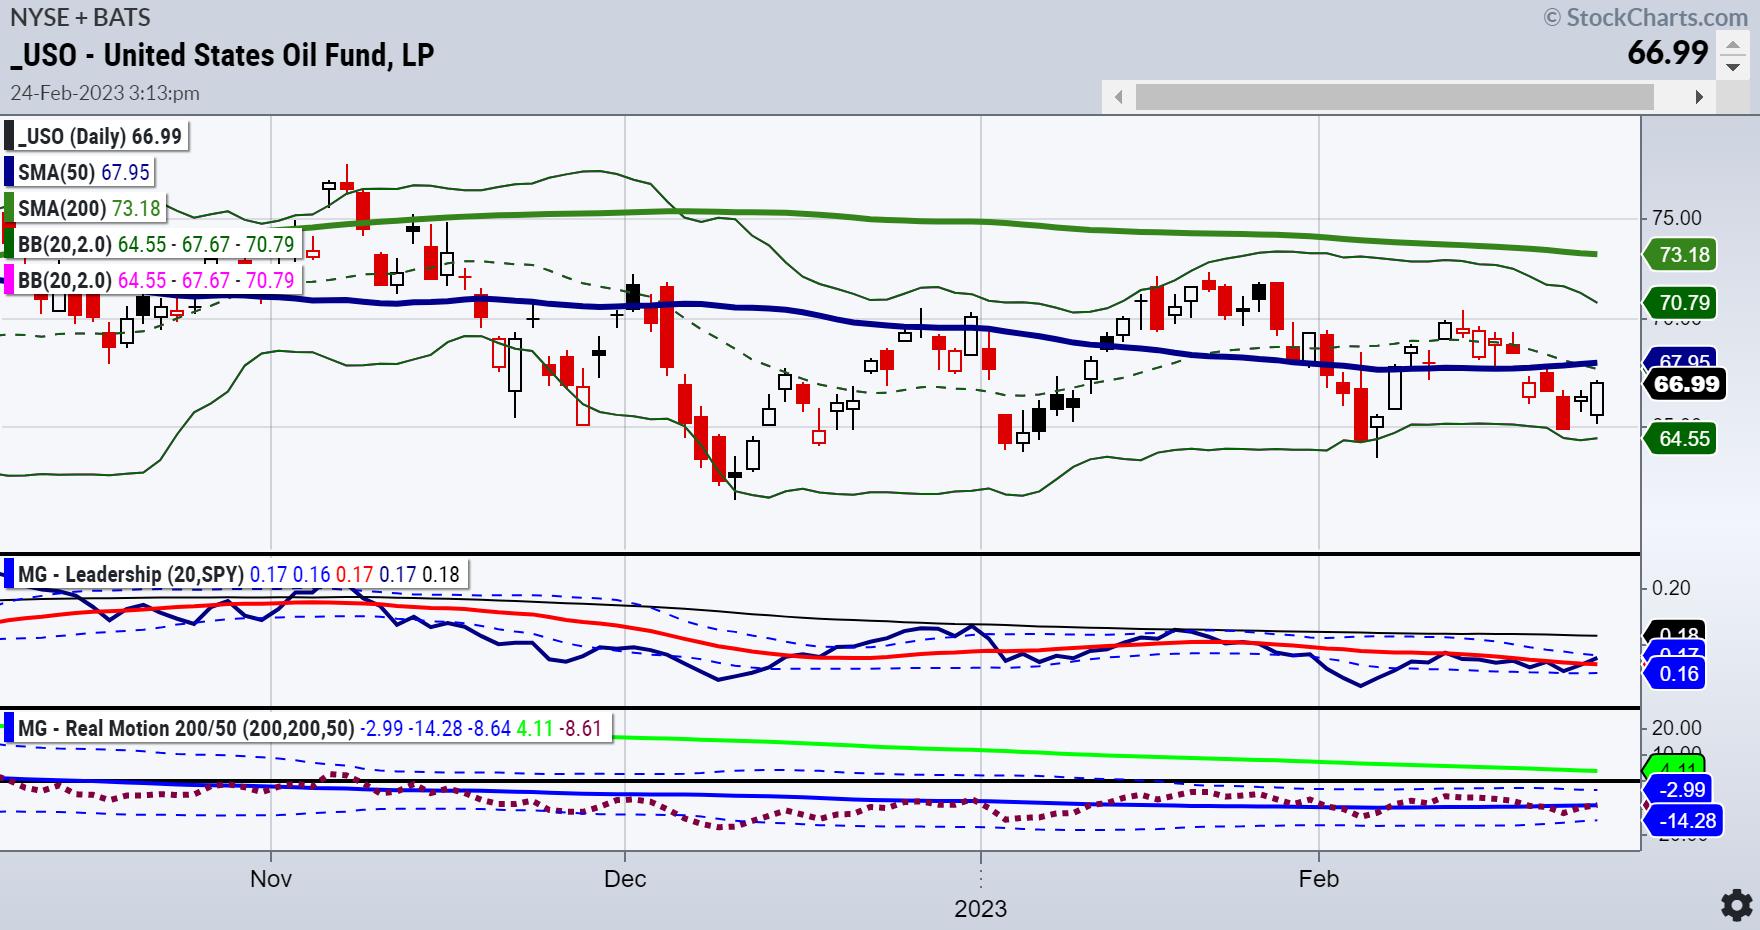
The Oil Service (OIH) chart, although the price sits under the 50-DMA, is still in a stronger phase than the USO chart.
OIH shows the 50-DMA above the 200-DMA. The USO charts shows the 50-DMA under the 200-DMA. OIH is in a warning phase while USO is in a bearish phase. (Check out our website for more on phases or pick up a copy of Plant Your Money Tree: A Guide to Growing Your Wealth.) However, OIH underperforms the benchmark according to our Stockcharts Plug in Triple Play indicator. And USO is now outperforming the benchmark.
Our Real Motion Indicator, also a StockCharts plugin, indicates a momentum diversion in USO, as the momentum recaptures its 50-DMA before the price does. Generally, when we see both a divergence in momentum and in triple play with an outperformance, we wait for a price confirmation. In USO, a move over 68.00 confirmed, would be a signal to buy.
Most likely, OIH, already in better shape, will move up as well.
The bigger point is that with natural gas potentially bottoming, oil potentially ready to go higher, and the oil services sector already in good shape, this is the place to watch this coming week. And, most importantly, we see commodities taking turns in leadership. That tells us the super cycle is getting ready and that commodities offer great active trading opportunities.
For more detailed trading information about our blended models, tools and trader education courses, contact Rob Quinn, our Chief Strategy Consultant, to learn more.
IT'S NOT TOO LATE! Click here if you'd like a complimentary copy of Mish's 2023 Market Outlook E-Book in your inbox.


"I grew my money tree and so can you!" - Mish Schneider
Get your copy of Plant Your Money Tree: A Guide to Growing Your Wealth and a special bonus here.
Follow Mish on Twitter @marketminute for stock picks and more. Follow Mish on Instagram (mishschneider) for daily morning videos. To see updated media clips, click here.
Mish in the Media
In her latest video for CMC Markets, MarketGauge's Mish Schneider shares insights on the gold, the S&P 500 and natural gas and what traders can expect as the markets remain mixed.
Mish and Charles talk food inflation and the Metaverse on Making Money with Charles Payne!
See Mish present "Best Trade, Worst Trade, Next Trade" on Business First AM.
Mish shares insights on the US Dollar, euro, gold and natural gas in this appearance on CMC Markets.
Mish shares three charts she is using to measure inflation using the commodities markets on the Wednesday, February 14 edition of StockCharts TV's The Final Bar with David Keller!
Mish gives you some ideas of what might outperform in this new wave of inflation on the Friday, February 10 edition of StockCharts TV's Your Daily Five. She has picks from energy, construction, gold, defense, and raw materials.
Read about Mish's interview with Neils Christensen in this article from Kitco!
ETF Summary
- S&P 500 (SPY): 390 support with 405 closest resistance.
- Russell 2000 (IWM): MA support around 184. 190 has to clear.
- Dow (DIA): 326 support, 335 resistance.
- Nasdaq (QQQ): 300 the pivotal area 290 major support284 big support 300 resistance.
- Regional banks (KRE): 65.00 resistance, 61 support.
- Semiconductors (SMH): 228 support 240 pivotal 248 key resistance 248 resistance 237 then 229 support.
- Transportation (IYT): Most interesting economic sector-Confirms back to a Bullish phase keeping bears on their toes and bulls hopeful.
- Biotechnology (IBB): 125-130 new range.
- Retail (XRT): 66-68 huge area to hold if the market still has legs.
Mish Schneider
MarketGauge.com
Director of Trading Research and Education


