What if sugar futures are really onto something?
What if they are relaying food shortages? More social disruption? The Start of Russian hoarding? Which leads to Geopolitical hell? And all the inflation theories that could still develop are staring us right in the face?
In the face of a rising U.S. dollar...
In the face of higher yields and a more hawkish Fed...
In the face of some cooling inflation indicators and a correction in gold...
In the face of a soft GDP...
In the face of a persistent trading range in the key indices...
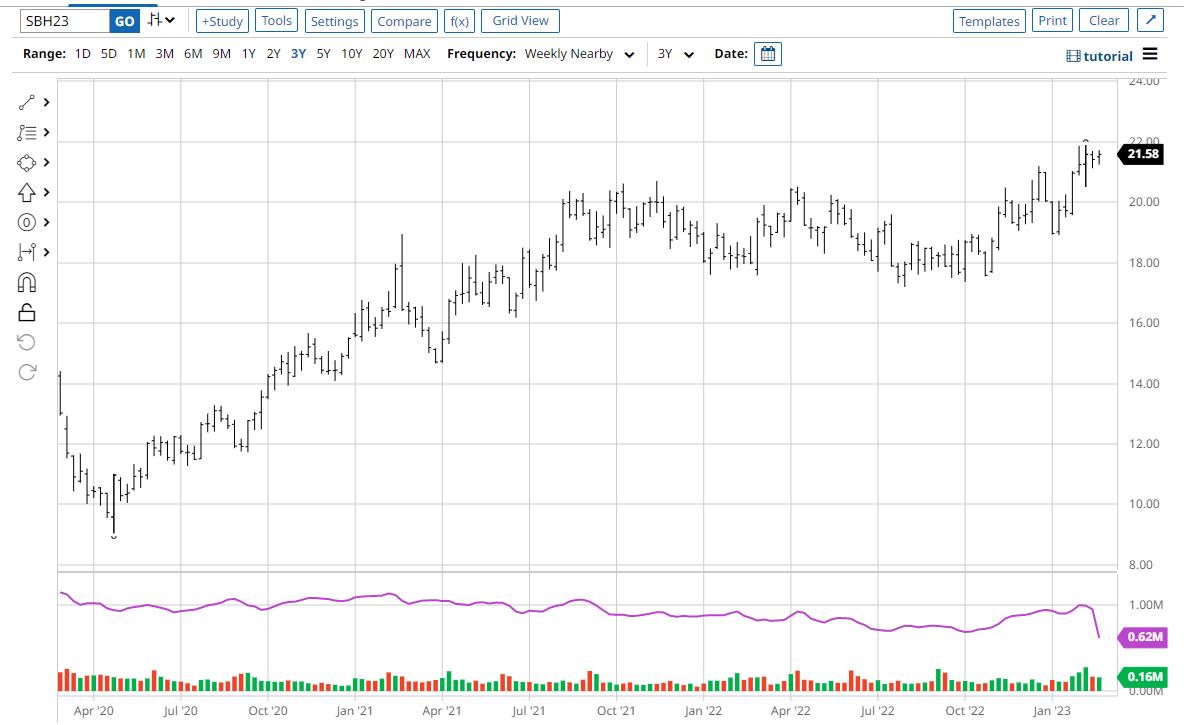
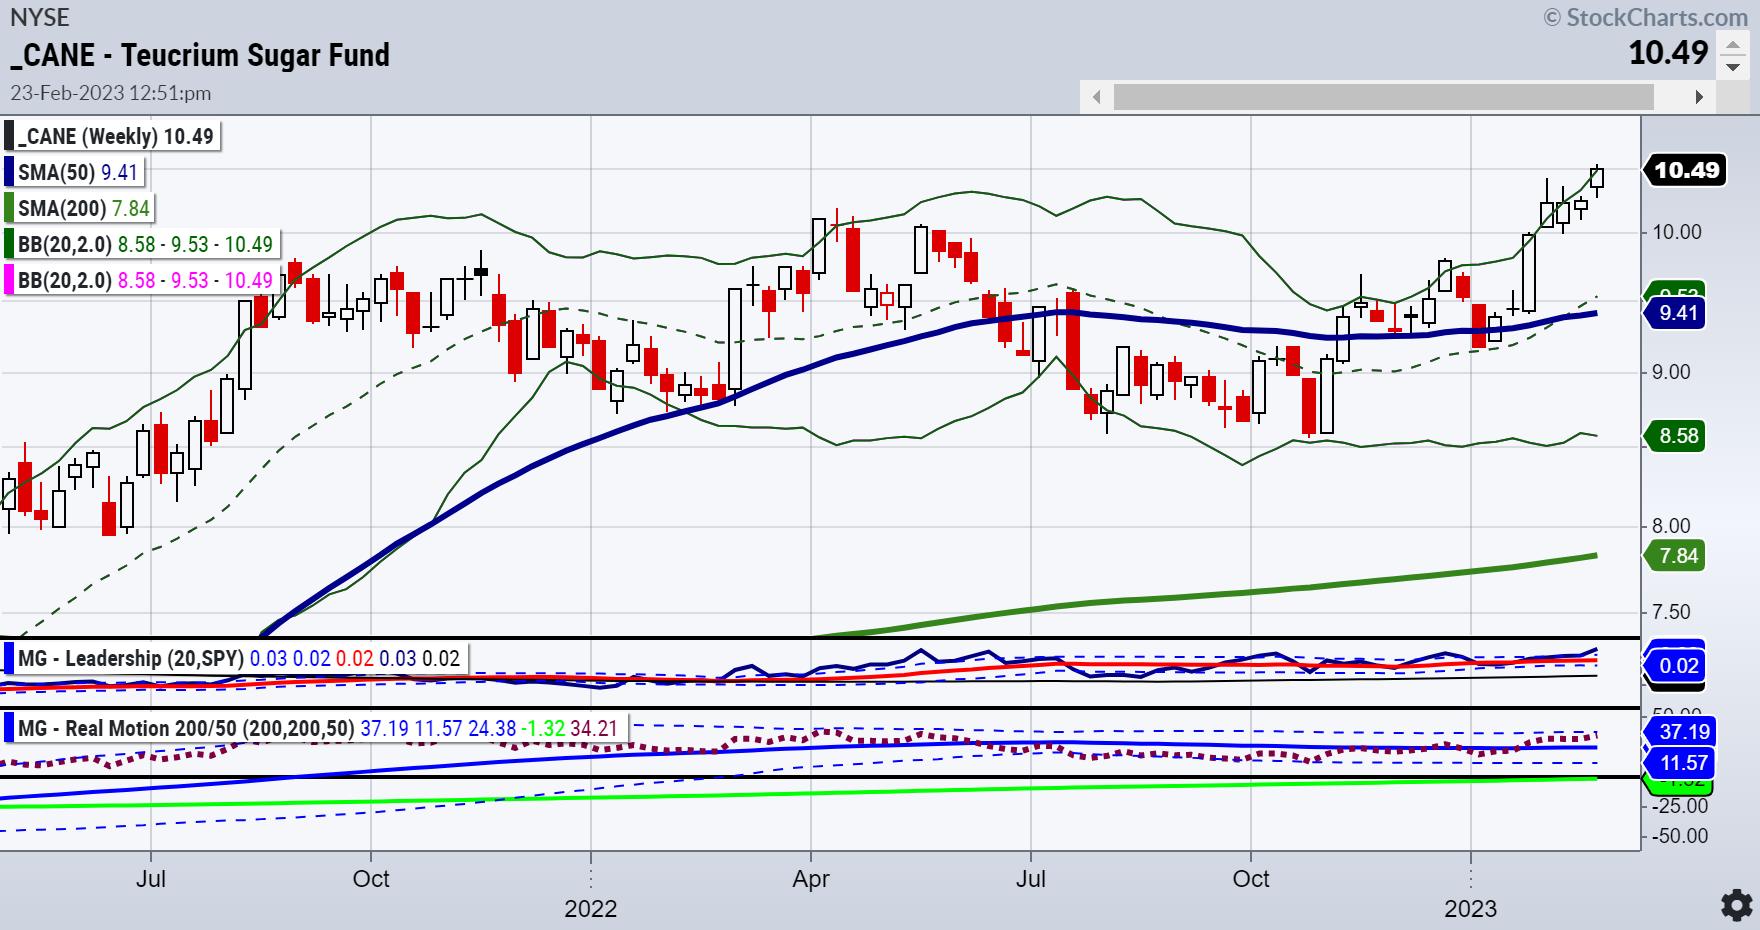
Sugar has gone up 225% since April 2020.
Sugar led the inflation rout in 1976 and then again in 1979. Sugar is in pretty much everything we consume. Heck, even Apple (AAPL) just announced a way to gauge your sugar levels if you have diabetes (1 in 3 Americans do). In other words, eat sugar, and we (Apple) got you.
The point is this... should this rout continue, pay attention. AI and growth stocks will not help feed the planet--not for a long time.
P.S. Tweet 2/22/23 at 8:19 AM ET: $UNG textbook blow off potential bottom on high volume. One to watch
Price 7.30 at the time. Up over 12% since then.
Commodities--don't give up.
For more detailed trading information about our blended models, tools and trader education courses, contact Rob Quinn, our Chief Strategy Consultant, to learn more.
IT'S NOT TOO LATE! Click here if you'd like a complimentary copy of Mish's 2023 Market Outlook E-Book in your inbox.


"I grew my money tree and so can you!" - Mish Schneider
Get your copy of Plant Your Money Tree: A Guide to Growing Your Wealth and a special bonus here.
Follow Mish on Twitter @marketminute for stock picks and more. Follow Mish on Instagram (mishschneider) for daily morning videos. To see updated media clips, click here.
Mish in the Media
Mish and Charles talk food inflation and the Metaverse on Making Money with Charles Payne!
See Mish present "Best Trade, Worst Trade, Next Trade" on Business First AM.
Mish shares insights on the US Dollar, euro, gold and natural gas in this appearance on CMC Markets.
Mish shares three charts she is using to measure inflation using the commodities markets on the Wednesday, February 14 edition of StockCharts TV's The Final Bar with David Keller!
Mish gives you some ideas of what might outperform in this new wave of inflation on the Friday, February 10 edition of StockCharts TV's Your Daily Five. She has picks from energy, construction, gold, defense, and raw materials.
Read about Mish's interview with Neils Christensen in this article from Kitco!
ETF Summary
- S&P 500 (SPY): 390 support with 405 closest resistance.
- Russell 2000 (IWM): MA support around 184. 190 has to clear again.
- Dow (DIA): 326 support 335 resistance.
- Nasdaq (QQQ): 300 the pivotal area 290 major support284 big support 300 resistance.
- Regional Banks (KRE): 65.00 resistance 61 support.
- Semiconductors (SMH): 240 pivotal with 248 key resistance 248 resistance 237 then 229 support.
- Transportation (IYT): Why we look for 2-day confirms on phases-back over the 50-DMA-228 support 232 resistance.
- Biotechnology (IBB): 125-130 new range.
- Retail (XRT): 66-68 huge area to hold if the market still has legs.
Mish Schneider
MarketGauge.com
Director of Trading Research and Education


