Below is just one of several headlines about stagflation we have seen this week.
From April 27, 2023, TheStreet.com:
"Stagflation Risks In Focus As U.S. Economy Slows, But Inflation Stays High"
"The coveted soft landing is looking increasingly difficult to achieve and we are now getting towards a position where the market may become concerned that stagflation could be a likely possibility. The next set of inflation statistics are going to be crucial for the subsequent moves by the Fed."
Now that stagflation has gone mainstream, we thought it a good time to review:
- How ahead of the curve we were; and
- If the trades we loved coming into a stagflationary environment are as exciting as they were when we were well ahead.
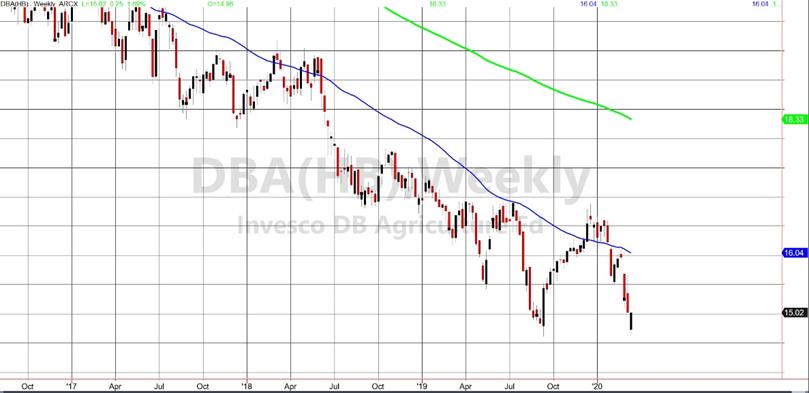
I dug up this Daily I wrote on February 26, 2020, PRE-COVID lockdowns. The chart of DBA (Agriculture Fund ETF) above, is from the same day.
"But what has held and could complete the 'flation' part of the stagflation scenario? Soft and agricultural commodities.
"Let's take an example: DBA. The 2019 low was 14.62. The 2020 low from yesterday is 14.65. That could be an auspicious double bottom.
"It also could be the start of what we are already seeing from the human 'psyche,' like the hoarding of toilet paper: The rising awareness that if food production and distribution begin to seriously falter, raw material prices will skyrocket."
Now, typically with everyone talking "stagflation", the trades we loved from 2020 until now have become less interesting.
Clearly, fresh news can emerge (Mother Nature, Social Unrest, Geopolitics, etc) and create a new spike in food and metal prices. However, the economy might have contracted enough and will now just limp along for a year or so. Plus, inflation might have peaked, but will stay elevated in more of a sideways pattern. If this turns out to be correct, the real nagging and difficult to navigate stagflation is here.
Truly, that is the most difficult time to invest. It is also when great stock pickers prevail.
Looking at the gold (GLD) chart from April 28, 2023 supports the not-as-interesting-now trade theory. GLD is trading under the 50-DMA (blue), confirming a caution phase. The island top from April 13th is intact. Generally, that is a reliable signal of a top where we could see a 10% decline in price from there. That could take GLD down to around 172-175.
Real Motion, MarketGauge's proprietary momentum indicator shows that GLD's momentum has declined. However, it is coming close to support at its 50-DMA and, if it holds, could mean the price clears back over the 50-DMA on the price chart.
So, we are not bearish or bullish right here. We are simply pointing out that we were incredibly bullish up until recently. Now, we need something fresh to happen to spike gold up above the island top. A decent trade, but not, as we have been touting before, the best trade we see.
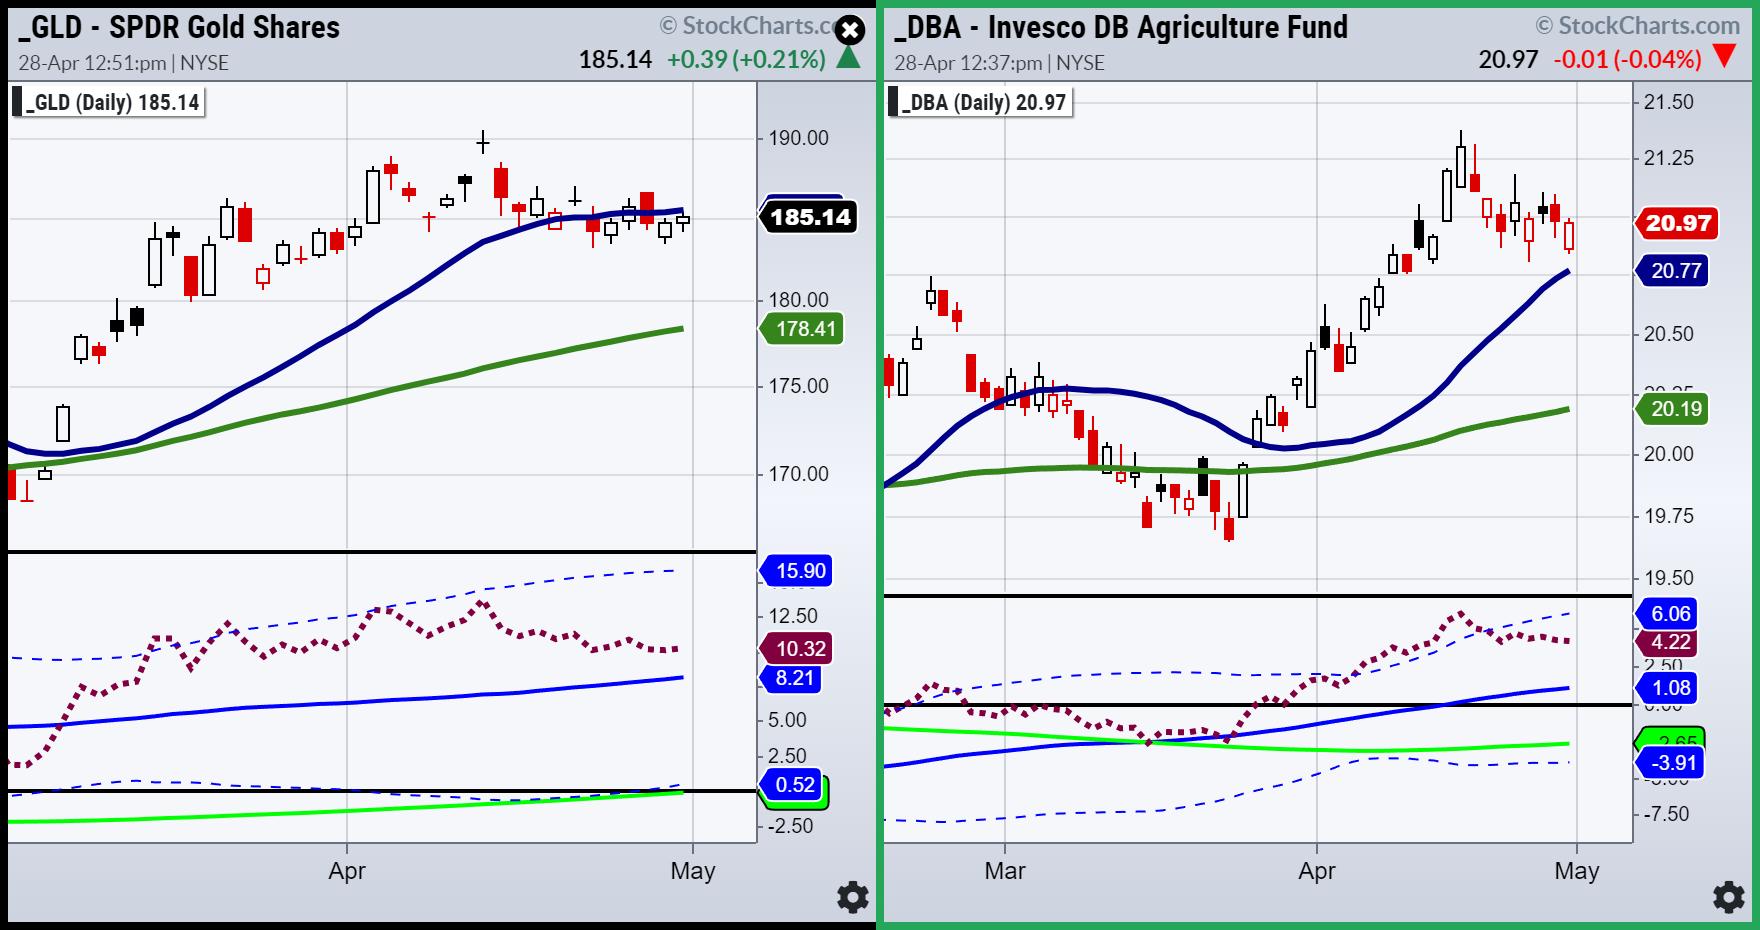
DBA is in a better chart position. It remains trading over its 50-DMA at 20.77. The phase is bullish, and the slope is positive. Should DBA hold above the 50-DMA and take out the recent highs, then we can assume one of those potential fresh news events happened. If not, the Real Motion indicator signaled a mean reversion on April 21st.
Momentum is declining, so we need to see that change to a more upward momentum and back over the Bollinger Band (dotted). Both GLD and DBA could turn out to be exciting, but right now, considering inflation might have peaked but will stay elevated in more of a sideways pattern, we are neutral both instruments.
As far as stock picking, please refer to all the articles written on the 23-month and 80-month moving averages on our website. Here is one: Gaining an Edge in a Tough Trading Year.
Our discretionary trading strategy is now based on finding instruments using our Complete Trader Scans that fits one of these setups:
- Buying instruments close to but holding the longer-term MA,
- Shorting instruments that have failed the shorter-term MA
- Buying momentum on instruments that are clearing the shorter-term MA.
- Keeping all trading light until the SPY clears the shorter-term MA. And when/if SPY does, we will buy but also watch to see if small caps (IWM) can get close to its MA at 200.
My prediction: SPY, QQQs, and DIA continue to rally until IWM cannot clear $200; then, everything sells off again.
Mish in the Media
Mish and Nicole Petallides discuss cycles, stagflation, commodities and some stock picks in this appearance on TD Ameritrade.
Mish talks movies and streaming stocks with Angela Miles on Business First AM.
Mish and Charles discuss zooming out, stagflation and picks outperforming stocks in this appearance on Making Money with Charles Payne.
We all know at this point how difficult the market has been with all of the varying opinions regarding recession, inflation, stagflation, the market's going to come back, the market's going to collapse - ad nauseam. What about the people stuck in the middle of a range bound market? Mish presents her top choices for shorts and longs on the Friday, April 21 edition of StockCharts TV's Your Daily Five.
Mish and Benzinga discuss the current trading ranges and what might break them.
Mish discusses what she'll be talking about at The Money Show, from April 24-26!
Mish walks you through technical analysis of TSLA and market conditions and presents an action plan on CMC Markets.
Mish presents two stocks to look at in this appearance on Business First AM -- one bullish, one bearish.
Mish joins David Keller on the Thursday, May 13 edition of StockCharts TV's The Final Bar, where she shares her charts of high yield bonds, semiconductors, gold, and regional banks.
Mish joins Wolf Financial for this Twitter Spaces event, where she and others discuss their experiences as former pit traders.
Mish shares her views on natural gas, crude oil and a selection of ETFs in this appearance on CMC Markets.
Mish talks what's next for the economy on Yahoo! Finance.
Mish joins Bob Lang of Explosive Options for a special webinar on what traders can expect in 2023!
Rosanna Prestia of The RO Show chats with Mish about commodities, macro and markets.
Coming Up:
May 2nd-5th: StockCharts TV Market Outlook
May 15th: Real Vision Daily Briefing
ETF Summary
- S&P 500 (SPY): 23-month MA 420.
- Russell 2000 (IWM): 170 support, 180 resistance.
- Dow (DIA): Over the 23-month MA-only index.
- Nasdaq (QQQ): 329 the 23-month MA.
- Regional banks (KRE): 43 now pivotal resistance.
- Semiconductors (SMH): 246 the 23-month MA.
- Transportation (IYT): 202-240 biggest range to watch.
- Biotechnology (IBB): 121-135 range to watch from monthly charts.
- Retail (XRT): 56-75 trading range to break one way or another.
Mish Schneider
MarketGauge.com
Director of Trading Research and Education


