The common refrain, "Sell in May..." gives this month a bad rap, but it doesn't deserve it.
May is historically one of the least volatile months of the year, as measured by its closing average return in the S&P 500 index. Since 1970, its average return has been only 0.49%. Considering December, January, and April are three of the top four best-performing months of the year, the market probably deserves a rest by May.
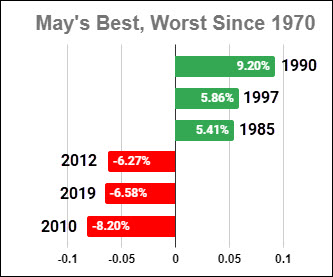
However, May doesn't always rest, and it's not lacking in historical volatility, as you can see from the chart above of the best and worst-performing months of May in the last 50 years.
There's also an interesting historical trend in May's performance intra-month. It tends to be weak to start, then rally in the latter part of the month. Interestingly, the patterns over the last 10 and 50 years are similar in that May has tended to bottom around the same day of the month in both timeframes.
As you can see in the chart below, the trends of the red line (10 years) and blue line (since 1970) both bottom out around the 13 to 15th trading day of the month.
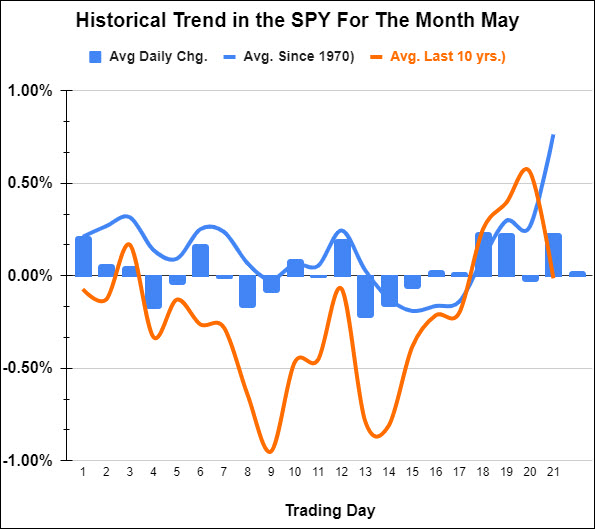
The 13th trading day of the month will be May 17. With a Fed announcement, earnings from Apple, Inc. (AAPL), and an employment report all this week, May could get off to a wild start. If history is any guide, and the market pulls back this week, look for a bounce around the ninth trading day of the month (May 11) and then a rally into the end of the month starting after May 17.
For more detailed trading information about our blended models, tools and trader education courses, contact Rob Quinn, our Chief Strategy Consultant, to learn more.
IT'S NOT TOO LATE! Click here if you'd like a complimentary copy of Mish's 2023 Market Outlook E-Book in your inbox.


"I grew my money tree and so can you!" - Mish Schneider
Get your copy of Plant Your Money Tree: A Guide to Growing Your Wealth and a special bonus here.
Follow Mish on Twitter @marketminute for stock picks and more. Follow Mish on Instagram (mishschneider) for daily morning videos. To see updated media clips, click here.
Mish in the Media
Mish and Nicole Petallides discuss cycles, stagflation, commodities and some stock picks in this appearance on TD Ameritrade.
Mish talks movies and streaming stocks with Angela Miles on Business First AM.
Mish and Charles discuss zooming out, stagflation and picks outperforming stocks in this appearance on Making Money with Charles Payne.
We all know at this point how difficult the market has been with all of the varying opinions regarding recession, inflation, stagflation, the market's going to come back, the market's going to collapse - ad nauseam. What about the people stuck in the middle of a range bound market? Mish presents her top choices for shorts and longs on the Friday, April 21 edition of StockCharts TV's Your Daily Five.
Mish and Benzinga discuss the current trading ranges and what might break them.
Mish discusses what she'll be talking about at The Money Show, from April 24-26!
Mish walks you through technical analysis of TSLA and market conditions and presents an action plan on CMC Markets.
Mish presents two stocks to look at in this appearance on Business First AM -- one bullish, one bearish.
Mish joins David Keller on the Thursday, May 13 edition of StockCharts TV's The Final Bar, where she shares her charts of high yield bonds, semiconductors, gold, and regional banks.
Mish joins Wolf Financial for this Twitter Spaces event, where she and others discuss their experiences as former pit traders.
Mish shares her views on natural gas, crude oil and a selection of ETFs in this appearance on CMC Markets.
Mish talks what's next for the economy on Yahoo! Finance.
Mish joins Bob Lang of Explosive Options for a special webinar on what traders can expect in 2023!
Rosanna Prestia of The RO Show chats with Mish about commodities, macro and markets.
Coming Up:
May 2nd-5th: StockCharts TV Market Outlook
ETF Summary
- S&P 500 (SPY): 23-month MA 420
- Russell 2000 (IWM): 170 support - 180 resistance
- Dow (DIA): Over the 23-month MA-only index
- Nasdaq (QQQ): 329 the 23-month MA
- Regional Banks (KRE): 43 now pivotal resistance
- Semiconductors (SMH): 246 the 23-month MA
- Transportation (IYT): 202-240 biggest range to watch
- Biotechnology (IBB): 121-135 range to watch from monthly charts
- Retail (XRT): 56-75 trading range to break one way or another.
Geoff Bysshe
MarketGauge.com
President